I recently got a lot of errors with one of my drives in TrueNAS Core.
These were the errors of that drive:
Current alerts:
Device: /dev/ada2, not capable of SMART self-check.
Device: /dev/ada2, failed to read SMART Attribute Data.
Device: /dev/ada2, Read SMART Self-Test Log Failed.
Device: /dev/ada2, Read SMART Error Log Failed.
.
Pool BackupPool01 state is ONLINE: One or more devices has experienced an
unrecoverable error. An attempt was made to correct the error. Applications
are unaffected.
Since my server is at a remote location I bought a new drive, replace the defect one and took it with me in order to do some testing at home.
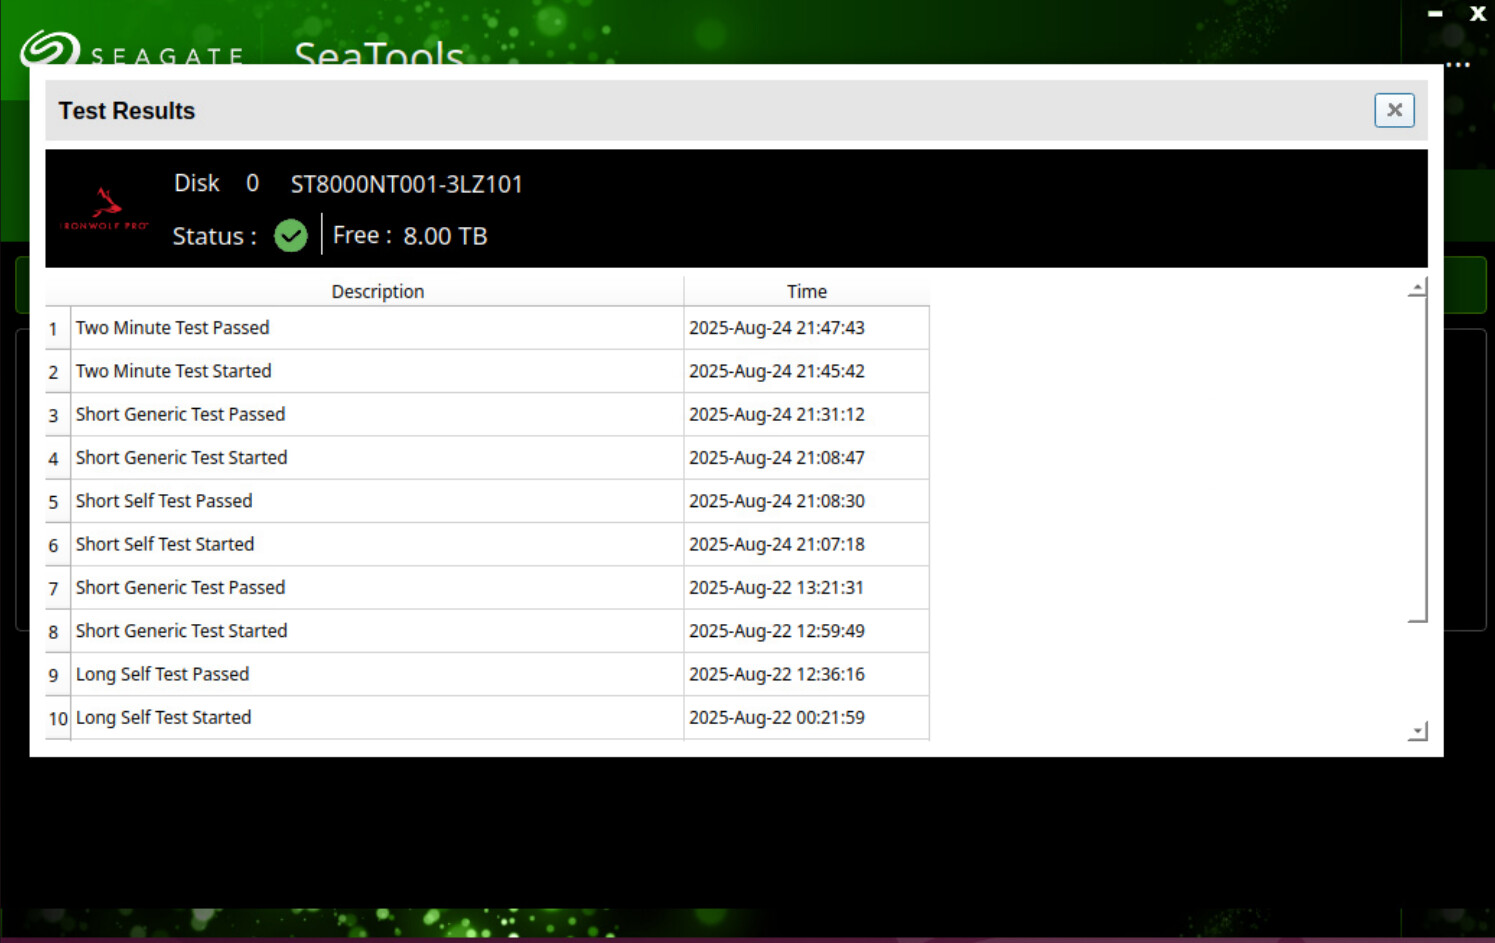
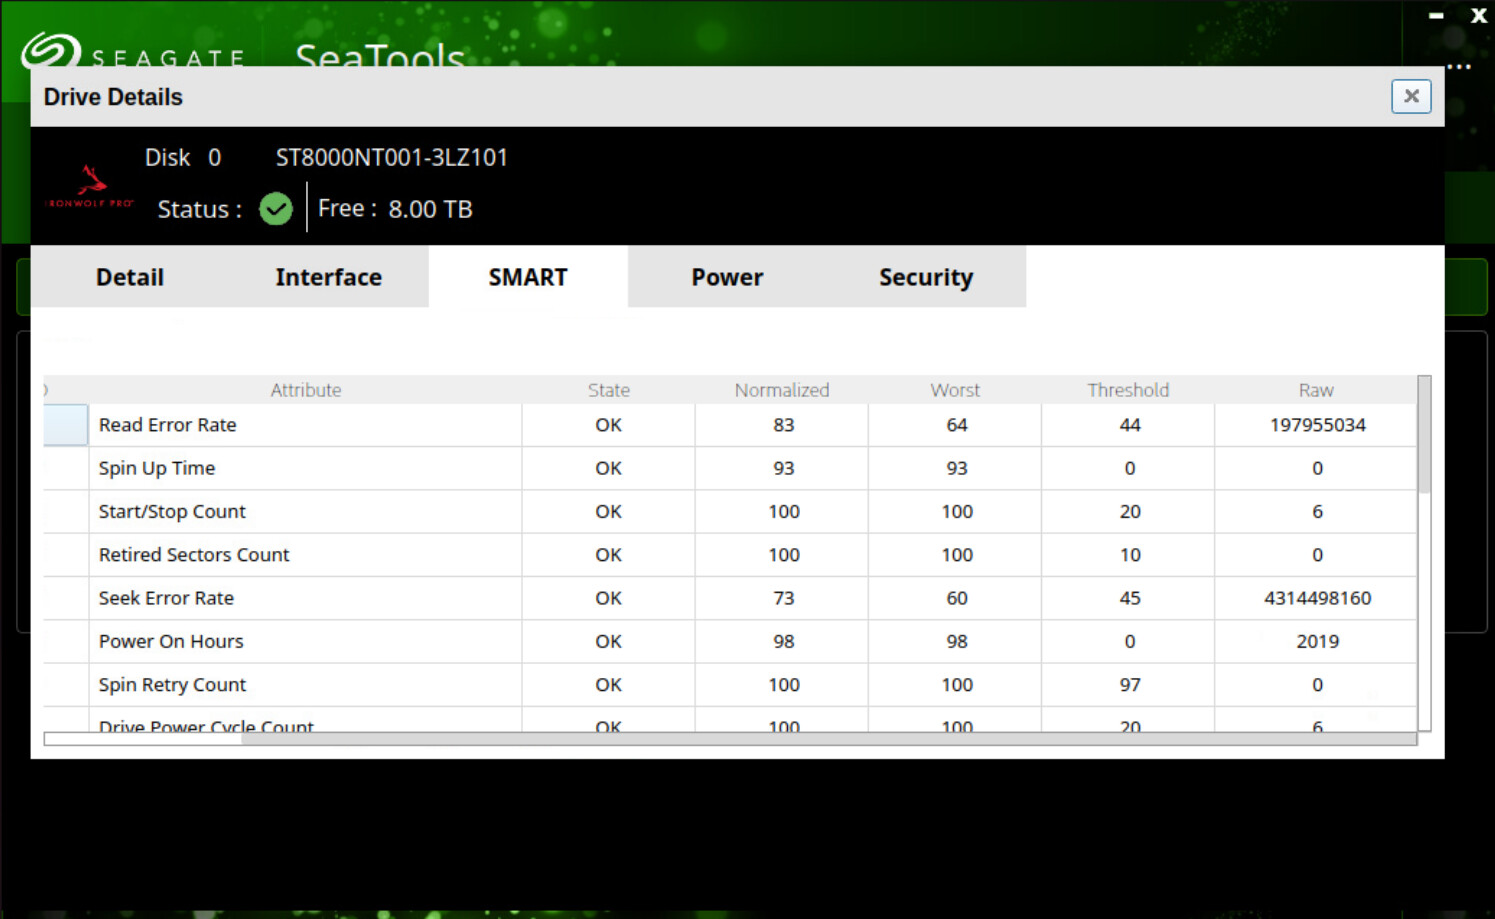
Since it’s an Ironwolf Pro drive, I used the Seatools from Seagate and apparently Seatools.
Unfortunately I couldn’t do more testing before replacing the drive and also installed TrueNAS Scale in the meantime.
However, does anyone have an idea what could have cause the TrueNAS alerts and furthermore, do the Seatools results actually mean that the drive is totally fine?
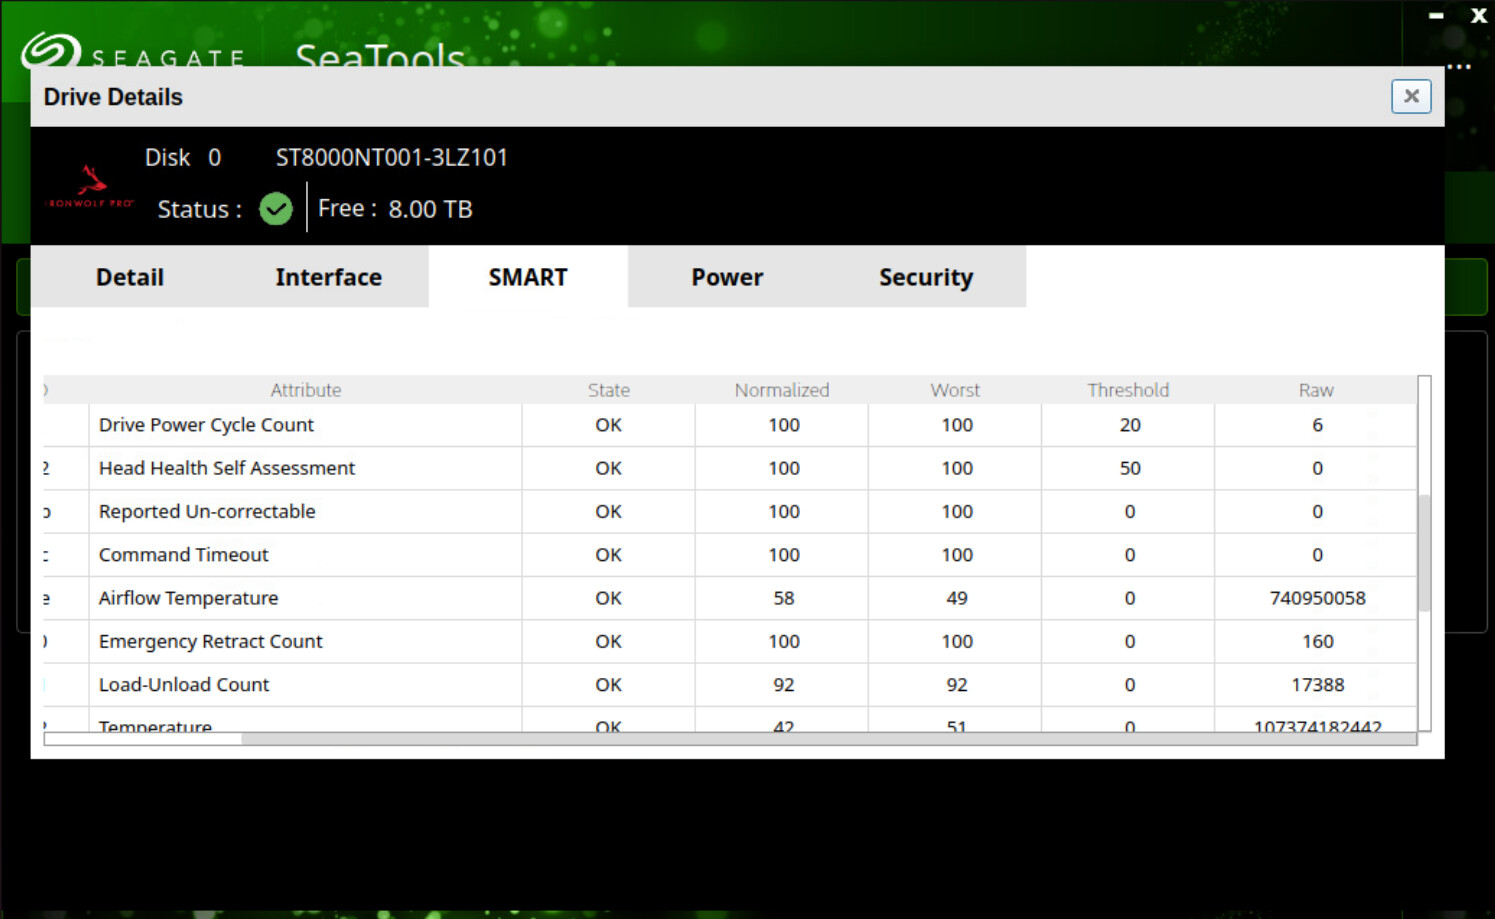
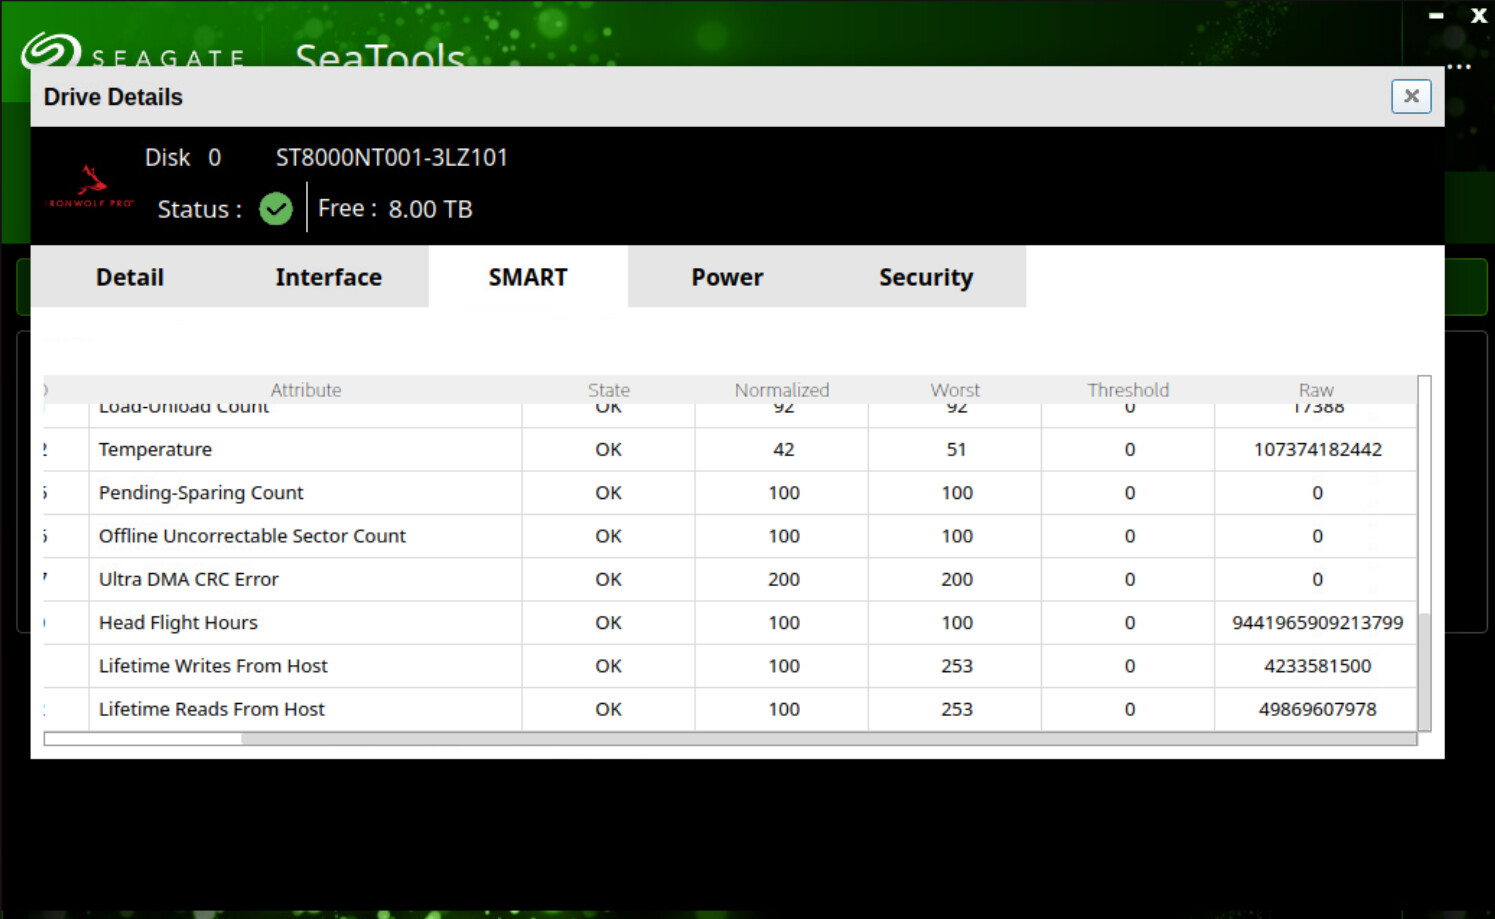
Nothing really indicates the drive is failed or failing.
Some errors might have happened because of bad cabling or a power issue.
The idling temperature at 44C could be lowered, maybe with better cooling, but it’s not alarming. This could also just be because of the different computer you have it currently installed inside.
Even though this is not a SMART test failure, the TrueNAS GUI will report it as a “failed test”. This was the case on Core, not sure if it has been fixed with SCALE/CE.
That’s quite a high load cycle count for a drive that’s apparently only been in operation for less than 3 months, especially for a NAS. I would use SeaChest to disable the aggressive power-saving features.[1]
To know for sure, I would run another extended (long) SMART selftest and see if it passes with no errors.
I would also disable the aggressive power-saving features using SeaChest.
Nothing seems to indicate you have a failing drive.
To rule out a fake “new” drive, I would also paste the output of this:
smartctl -l farm /dev/sdX
I recommend this for any other Iron Wolf and Exos you might be using in your NAS. For some reason, Seagate defaults to aggressive power-saving. They cannot be changed with hdparm or smartctl or any tools within TrueNAS. It’s required to use Seagate’s own software. ↩︎
you’re right. The HDD currently sits on my desk without any cooling at all. My TrueNAS server has proper cooling.
smartctl 7.4 2023-08-01 r5530 [x86_64-linux-6.14.0-28-generic] (local build)
Copyright (C) 2002-23, Bruce Allen, Christian Franke, www.smartmontools.org

Seagate Field Access Reliability Metrics log (FARM) (GP Log 0xa6)
	FARM Log Page 0: Log Header
		FARM Log Version: 4.29
		Pages Supported: 6
		Log Size: 98304
		Page Size: 16384
		Heads Supported: 24
		Number of Copies: 0
		Reason for Frame Capture: 0
	FARM Log Page 1: Drive Information
		Serial Number: xxxxxx
		World Wide Name: xxxxxx
		Device Interface: SATA
		Device Capacity in Sectors: 15628053168
		Physical Sector Size: 4096
		Logical Sector Size: 512
		Device Buffer Size: 268435456
		Number of Heads: 8
		Device Form Factor: 3.5 inches
		Rotation Rate: 7200 rpm
		Firmware Rev: EN01
		ATA Security State (ID Word 128): 0x01629
		ATA Features Supported (ID Word 78): 0x016cc
		ATA Features Enabled (ID Word 79): 0x000000000000004c
		Power on Hours: 2039
		Spindle Power on Hours: 1835
		Head Flight Hours: 634
		Head Load Events: 17388
		Power Cycle Count: 7
		Hardware Reset Count: 30
		Spin-up Time: 0 ms
		Time to ready of the last power cycle: 19022 ms
		Time drive is held in staggered spin: 0 ms
		Model Number: ST8000NT001-3LZ101
		Drive Recording Type: CMR
		Max Number of Available Sectors for Reassignment: 16384
		Assembly Date (YYWW): 4225
		Depopulation Head Mask: 0
	FARM Log Page 2: Workload Statistics
		Total Number of Read Commands: 80563697
		Total Number of Write Commands: 6124030
		Total Number of Random Read Commands: 187289
		Total Number of Random Write Commands: 5779034
		Total Number Of Other Commands: 872107
		Logical Sectors Written: 4233517628
		Logical Sectors Read: 50136970403
		Number of dither events during current power cycle: 276
		Number of times dither was held off during random workloads: 306
		Number of times dither was held off during sequential workloads: 3937
		Number of Read commands from 0-3.125% of LBA space for last 3 SMART Summary Frames: 2791625
		Number of Read commands from 3.125-25% of LBA space for last 3 SMART Summary Frames: 2365741
		Number of Read commands from 25-75% of LBA space for last 3 SMART Summary Frames: 3245086
		Number of Read commands from 75-100% of LBA space for last 3 SMART Summary Frames: 4702348
		Number of Write commands from 0-3.125% of LBA space for last 3 SMART Summary Frames: 8112
		Number of Write commands from 3.125-25% of LBA space for last 3 SMART Summary Frames: 0
		Number of Write commands from 25-75% of LBA space for last 3 SMART Summary Frames: 0
		Number of Write commands from 75-100% of LBA space for last 3 SMART Summary Frames: 202676
	FARM Log Page 3: Error Statistics
		Unrecoverable Read Errors: 0
		Unrecoverable Write Errors: 0
		Number of Reallocated Sectors: 0
		Number of Read Recovery Attempts: 0
		Number of Mechanical Start Failures: 0
		Number of Reallocated Candidate Sectors: 0
		Number of ASR Events: 3
		Number of Interface CRC Errors: 0
		Spin Retry Count: 0
		Spin Retry Count Normalized: 100
		Spin Retry Count Worst: 100
		Number of IOEDC Errors (Raw): 0
		CTO Count Total: 0
		CTO Count Over 5s: 0
		CTO Count Over 7.5s: 0
		Total Flash LED (Assert) Events: 0
		Index of the last Flash LED: 0
		Flash LED Event 0:
			Event Information: 0x0000000000000000
			Timestamp of Event 0 (hours): 0
			Power Cycle Event 0: 0
		Flash LED Event 1:
			Event Information: 0x0000000000000000
			Timestamp of Event 1 (hours): 0
			Power Cycle Event 1: 0
		Flash LED Event 2:
			Event Information: 0x0000000000000000
			Timestamp of Event 2 (hours): 0
			Power Cycle Event 2: 0
		Flash LED Event 3:
			Event Information: 0x0000000000000000
			Timestamp of Event 3 (hours): 0
			Power Cycle Event 3: 0
		Flash LED Event 4:
			Event Information: 0x0000000000000000
			Timestamp of Event 4 (hours): 0
			Power Cycle Event 4: 0
		Flash LED Event 5:
			Event Information: 0x0000000000000000
			Timestamp of Event 5 (hours): 0
			Power Cycle Event 5: 0
		Flash LED Event 6:
			Event Information: 0x0000000000000000
			Timestamp of Event 6 (hours): 0
			Power Cycle Event 6: 0
		Flash LED Event 7:
			Event Information: 0x0000000000000000
			Timestamp of Event 7 (hours): 0
			Power Cycle Event 7: 0
		Uncorrectable errors: 0
		Cumulative Lifetime Unrecoverable Read errors due to ERC: 0
		Cum Lifetime Unrecoverable by head 0:
			Cumulative Lifetime Unrecoverable Read Repeating: 0
			Cumulative Lifetime Unrecoverable Read Unique: 0
		Cum Lifetime Unrecoverable by head 1:
			Cumulative Lifetime Unrecoverable Read Repeating: 0
			Cumulative Lifetime Unrecoverable Read Unique: 0
		Cum Lifetime Unrecoverable by head 2:
			Cumulative Lifetime Unrecoverable Read Repeating: 0
			Cumulative Lifetime Unrecoverable Read Unique: 0
		Cum Lifetime Unrecoverable by head 3:
			Cumulative Lifetime Unrecoverable Read Repeating: 0
			Cumulative Lifetime Unrecoverable Read Unique: 0
		Cum Lifetime Unrecoverable by head 4:
			Cumulative Lifetime Unrecoverable Read Repeating: 0
			Cumulative Lifetime Unrecoverable Read Unique: 0
		Cum Lifetime Unrecoverable by head 5:
			Cumulative Lifetime Unrecoverable Read Repeating: 0
			Cumulative Lifetime Unrecoverable Read Unique: 0
		Cum Lifetime Unrecoverable by head 6:
			Cumulative Lifetime Unrecoverable Read Repeating: 0
			Cumulative Lifetime Unrecoverable Read Unique: 0
		Cum Lifetime Unrecoverable by head 7:
			Cumulative Lifetime Unrecoverable Read Repeating: 0
			Cumulative Lifetime Unrecoverable Read Unique: 0
	FARM Log Page 4: Environment Statistics
		Current Temperature (Celsius): 44
		Highest Temperature: 51
		Lowest Temperature: 30
		Average Short Term Temperature: 44
		Average Long Term Temperature: 42
		Highest Average Short Term Temperature: 47
		Lowest Average Short Term Temperature: 34
		Highest Average Long Term Temperature: 42
		Lowest Average Long Term Temperature: 37
		Time In Over Temperature (minutes): 0
		Time In Under Temperature (minutes): 0
		Specified Max Operating Temperature: 60
		Specified Min Operating Temperature: 5
		Current Relative Humidity: 0
		Current Motor Power: 3567
		Current 12 volts: 12.157
		Minimum 12 volts: 11.968
		Maximum 12 volts: 12.164
		Current 5 volts: 4.987
		Minimum 5 volts: 4.929
		Maximum 5 volts: 5.019
		12V Power Average: 0.000
		12V Power Minimum: 0.000
		12V Power Maximum: 0.000
		5V Power Average: 0.000
		5V Power Minimum: 0.000
		5V Power Maximum: 0.000
	FARM Log Page 5: Reliability Statistics
		Error Rate (SMART Attribute 1 Raw): 0x00000000029796ef
		Error Rate (SMART Attribute 1 Normalized): 76
		Error Rate (SMART Attribute 1 Worst): 64
		Seek Error Rate (SMART Attr 7 Raw): 0x00000000012f28d7
		Seek Error Rate (SMART Attr 7 Normalized): 73
		Seek Error Rate (SMART Attr 7 Worst): 60
		High Priority Unload Events: 160
		Helium Pressure Threshold Tripped: 0
		LBAs Corrected By Parity Sector: 0
		DVGA Skip Write Detect by Head 0: 0
		DVGA Skip Write Detect by Head 1: 0
		DVGA Skip Write Detect by Head 2: 0
		DVGA Skip Write Detect by Head 3: 0
		DVGA Skip Write Detect by Head 4: 0
		DVGA Skip Write Detect by Head 5: 0
		DVGA Skip Write Detect by Head 6: 0
		DVGA Skip Write Detect by Head 7: 0
		RVGA Skip Write Detect by Head 0: 0
		RVGA Skip Write Detect by Head 1: 0
		RVGA Skip Write Detect by Head 2: 0
		RVGA Skip Write Detect by Head 3: 0
		RVGA Skip Write Detect by Head 4: 0
		RVGA Skip Write Detect by Head 5: 0
		RVGA Skip Write Detect by Head 6: 0
		RVGA Skip Write Detect by Head 7: 0
		FVGA Skip Write Detect by Head 0: 0
		FVGA Skip Write Detect by Head 1: 0
		FVGA Skip Write Detect by Head 2: 0
		FVGA Skip Write Detect by Head 3: 0
		FVGA Skip Write Detect by Head 4: 0
		FVGA Skip Write Detect by Head 5: 0
		FVGA Skip Write Detect by Head 6: 0
		FVGA Skip Write Detect by Head 7: 0
		Skip Write Detect Threshold Exceeded by Head 0: 0
		Skip Write Detect Threshold Exceeded by Head 1: 0
		Skip Write Detect Threshold Exceeded by Head 2: 0
		Skip Write Detect Threshold Exceeded by Head 3: 0
		Skip Write Detect Threshold Exceeded by Head 4: 0
		Skip Write Detect Threshold Exceeded by Head 5: 0
		Skip Write Detect Threshold Exceeded by Head 6: 0
		Skip Write Detect Threshold Exceeded by Head 7: 0
		Write Power On (hrs) by Head 0: 69850030
		Write Power On (hrs) by Head 1: 139989051
		Write Power On (hrs) by Head 2: 20078237
		Write Power On (hrs) by Head 3: 39207022
		Write Power On (hrs) by Head 4: 40131719
		Write Power On (hrs) by Head 5: 129211914
		Write Power On (hrs) by Head 6: 87886444
		Write Power On (hrs) by Head 7: 57607754
		MR Head Resistance from Head 0: 459
		MR Head Resistance from Head 1: 438
		MR Head Resistance from Head 2: 500
		MR Head Resistance from Head 3: 524
		MR Head Resistance from Head 4: 441
		MR Head Resistance from Head 5: 449
		MR Head Resistance from Head 6: 468
		MR Head Resistance from Head 7: 508
		Second MR Head Resistance by Head 0: 437
		Second MR Head Resistance by Head 1: 424
		Second MR Head Resistance by Head 2: 437
		Second MR Head Resistance by Head 3: 400
		Second MR Head Resistance by Head 4: 461
		Second MR Head Resistance by Head 5: 503
		Second MR Head Resistance by Head 6: 497
		Second MR Head Resistance by Head 7: 406
		Number of Reallocated Sectors by Head 0: 0
		Number of Reallocated Sectors by Head 1: 0
		Number of Reallocated Sectors by Head 2: 0
		Number of Reallocated Sectors by Head 3: 0
		Number of Reallocated Sectors by Head 4: 0
		Number of Reallocated Sectors by Head 5: 0
		Number of Reallocated Sectors by Head 6: 0
		Number of Reallocated Sectors by Head 7: 0
		Number of Reallocation Candidate Sectors by Head 0: 0
		Number of Reallocation Candidate Sectors by Head 1: 0
		Number of Reallocation Candidate Sectors by Head 2: 0
		Number of Reallocation Candidate Sectors by Head 3: 0
		Number of Reallocation Candidate Sectors by Head 4: 0
		Number of Reallocation Candidate Sectors by Head 5: 0
		Number of Reallocation Candidate Sectors by Head 6: 0
		Number of Reallocation Candidate Sectors by Head 7: 0
I checked that before and looked for power on hours. these seem reasonable since I bought this drive in April.
will do. Takes roughly 12 hours
That’s interesting. I didn’t know about the power-saving feature. Unfortunately Seachest is only available for windows. I gotta figure out a way to spin up a windows machine with SATA ports.
I’m gonna check my other drives to see if that’s the same behaviour.
It appears that the drive has aggressive head parking enabled. This can cause delays in response to read or write requests. Not sure if that will cause HDD errors to show up in the TrueNAS alerts. However, this can lead to premature head parking failure. Why a NAS drive would have this enabled by default, I am not sure.
Their are ways through hdparm to disable this aggressive head parking. However, I am not sure how to do it for your HDD.
You can wget the .zip file, extract it, and then run the Linux binaries directly.
I wouldn’t recommend this approach.
It’s probably safer to shut down the server, boot into a Linux live ISO, and download and run SeaChest from this environment. You want to make sure that nothing is using the drives as you use the SeaChest commands on them. You should make sure that you’re not running any formatting commands and only stick to the power-saving commands.
FWIW, I booted into an Ubuntu live ISO, downloaded SeaChest, and ran the commands on six Exos drives.
Here is how to disable the aggressive power-saving on a Seagate drive:
Thanks Winnie, that walk through is really helpful, but I can’t help but describe this as someone pointing to a mountain, saying “See that? Walk up it carrying this sack of rocks”. At least I know what to do, even if I hate the steps that I have to take.
One more question: is it better to pick an OS that does not recognise ZFS, or one that does? ie Does the OS just need to recognise there are disks present to run these commands, or does it need to import an entire pool
No live Linux ISO should automatically attempt to import your pools without user-intervention. Unless some are now doing so? I would hope not!
You just need a modern Linux system that can run the SeaChest binaries, which pretty much any live boot ISO should handle just fine. No reason to recognize or import a ZFS pool. Better to leave them unused and unimported.
It’s probably safe to run the above commands on an active TrueNAS system, but I don’t mind losing some minutes of downtime to do it outside of TrueNAS. When it comes to a NAS, you’re usually dealing with invaluable data. Might as well take the extra precautions.
I admit I skimmed this, but in the system reporting problems reading the SMART status, how is the drive connected?
SATA cable straight to the motherboard, some form of backplane to IT-mode HBA, SATA to USB adapter, etc?
All the data on the SMART output looks good. It shows me that the drive was not very active, the heads unloaded and remained there for a while, loaded and did a few things, unloaded and waited. You did not write nor read much data over all those hours of use.
Why would the drive act this way? The only reason off the to of my head, the power management settings you have setup in TrueNAS.
Could this have caused an issue? Possibly even though it should not.
Your issue could also be related to the HBA so keep an eye on the replacement drive.
The “suspect” drive, I’d run badblocks on it but the error messages you received were not about media issues, it was the drive not responding fast enough.
What version of Core are you running there? I’m curious.
Thanks for the walkthrough. I’ve got some new drives (Seagate) arriving in the next week, so I’ll try and do all the drive updates at once. Then add a short write up for other Seagate suckers drive purchasers…
good point. I checked the Adv. Power Management settings for every disk in my TrueNAS Server and 4 of them (out of 8) in different pools had “Level 128 - Minimum power usage without Standby (no spindown)” activated.
The 4 drive which where Adv. Power Management is disabled are the ones I replaced recently.
I can’t really recall what settings I did many years ago but I could explain this to myself the way that I activated “Level 128 - Minimum power usage without Standby (no spindown)” for all drives and after replacing broken down drives, “disabled” is the set by default.
Could there be a connection between this power saving feature and the load cycle count?
Furthermore I checked all HDDs for power_on_hours and power_cycle_count and load_cycle_count:
dev
Pool
Model
Disk Size
Adv. PM
Power on Hours
Load Cycle Counts
Power Cycle Count
Notes
sdk
BackupPool01
Ironwolf
8TB
128
70337
118412
192
sdj
BackupPool01
Ironwolf Pro
8TB
disabled
825
1754
9
replaced recently
sdc
Pool01
Ironwolf
8TB
128
70342
20352
191
sdb
Pool01
Ironwolf
8TB
128
49619
15973
135
sdl
Pool01
Ironwolf
8TB
128
47164
15961
125
sdi
Pool01
Ironwolf
8TB
disabled
4397
7107
18
replaced recently
sda
Pool01
Ironwolf Pro
16TB
disabled
3371
6898
16
replaced recently
sdf
Pool01
Ironwolf Pro
16TB
disabled
3365
6893
14
replaced recently
Do you mean how it is connected right now when doing the smartctl? Right know it is connected via sata to a zimba board.
When this issue occured I was running the latest TrueNAS Core 13.3. However, after replacing the drive I also did a fresh TrueNAS Scale install.
Iron Wolf and Exos ignore those settings. That’s why you need to use Seagate’s SeaChest tool to permanently change or disable the power-saving features.
My Exos, which has been running for almost 9 months now, has a load cycle count of 375. That averages to less than two per day. Many of those are from when I was doing my testing before creating a pool and whenever I reboot the server.
This matches up pretty good with @macx979 values. Some better and some worse but not my very much.
I am curious why both of you have so many unloads. I only have one Iron Wolf Drive and it has 20775 hours, yet only 952 Load Cycle Count, then subtract the 141 Power Off events = 811, the math comes out to .03 times a day. This is on my CORE system. I have APM set to 1 and Acoustic Disabled.
back to the hdd in question. I did another long smart test and at least to me it looks okish.
smartctl 7.4 2023-08-01 r5530 [x86_64-linux-6.14.0-28-generic] (local build)
Copyright (C) 2002-23, Bruce Allen, Christian Franke, www.smartmontools.org

=== START OF INFORMATION SECTION ===
Device Model:     ST8000NT001-3LZ101
Serial Number:    xxxxxxx
LU WWN Device Id: xxxxxxx
Firmware Version: EN01
User Capacity:    8,001,563,222,016 bytes [8.00 TB]
Sector Sizes:     512 bytes logical, 4096 bytes physical
Rotation Rate:    7200 rpm
Form Factor:      3.5 inches
Device is:        Not in smartctl database 7.3/5528
ATA Version is:   ACS-4 (minor revision not indicated)
SATA Version is:  SATA 3.3, 6.0 Gb/s (current: 6.0 Gb/s)
Local Time is:    Wed Aug 27 11:03:31 2025 CEST
SMART support is: Available - device has SMART capability.
SMART support is: Enabled
AAM feature is:   Unavailable
APM feature is:   Unavailable
Rd look-ahead is: Enabled
Write cache is:   Enabled
DSN feature is:   Disabled
ATA Security is:  Disabled, frozen [SEC2]
Write SCT (Get) Feature Control Command failed: scsi error unsupported field in scsi command
Wt Cache Reorder: Unknown (SCT Feature Control command failed)

=== START OF READ SMART DATA SECTION ===
SMART overall-health self-assessment test result: PASSED

General SMART Values:
Offline data collection status:  (0x82)	Offline data collection activity
					was completed without error.
					Auto Offline Data Collection: Enabled.
Self-test execution status:      (   0)	The previous self-test routine completed
					without error or no self-test has ever
					been run.
Total time to complete Offline
data collection: 		(  567) seconds.
Offline data collection
capabilities: 			 (0x7b) SMART execute Offline immediate.
					Auto Offline data collection on/off support.
					Suspend Offline collection upon new
					command.
					Offline surface scan supported.
					Self-test supported.
					Conveyance Self-test supported.
					Selective Self-test supported.
SMART capabilities:            (0x0003)	Saves SMART data before entering
					power-saving mode.
					Supports SMART auto save timer.
Error logging capability:        (0x01)	Error logging supported.
					General Purpose Logging supported.
Short self-test routine
recommended polling time: 	 (   1) minutes.
Extended self-test routine
recommended polling time: 	 ( 728) minutes.
Conveyance self-test routine
recommended polling time: 	 (   2) minutes.
SCT capabilities: 	       (0x50bd)	SCT Status supported.
					SCT Error Recovery Control supported.
					SCT Feature Control supported.
					SCT Data Table supported.

SMART Attributes Data Structure revision number: 10
Vendor Specific SMART Attributes with Thresholds:
ID# ATTRIBUTE_NAME          FLAGS    VALUE WORST THRESH FAIL RAW_VALUE
  1 Raw_Read_Error_Rate     POSR--   076   064   044    -    43489007
  3 Spin_Up_Time            PO----   093   093   000    -    0
  4 Start_Stop_Count        -O--CK   100   100   020    -    6
  5 Reallocated_Sector_Ct   PO--CK   100   100   010    -    0
  7 Seek_Error_Rate         POSR--   075   060   045    -    4324064560
  9 Power_On_Hours          -O--CK   098   098   000    -    2081
 10 Spin_Retry_Count        PO--C-   100   100   097    -    0
 12 Power_Cycle_Count       -O--CK   100   100   020    -    6
 18 Unknown_Attribute       PO-R--   100   100   050    -    0
187 Reported_Uncorrect      -O--CK   100   100   000    -    0
188 Command_Timeout         -O--CK   100   100   000    -    0
190 Airflow_Temperature_Cel -O---K   054   049   000    -    46 (Min/Max 42/50)
192 Power-Off_Retract_Count -O--CK   100   100   000    -    160
193 Load_Cycle_Count        -O--CK   092   092   000    -    17390
194 Temperature_Celsius     -O---K   046   051   000    -    46 (0 25 0 0 0)
197 Current_Pending_Sector  -O--C-   100   100   000    -    0
198 Offline_Uncorrectable   ----C-   100   100   000    -    0
199 UDMA_CRC_Error_Count    -OSRCK   200   200   000    -    0
240 Head_Flying_Hours       ------   100   100   000    -    677 (106 41 0)
241 Total_LBAs_Written      ------   100   253   000    -    4233581500
242 Total_LBAs_Read         ------   100   253   000    -    50204602988
                            ||||||_ K auto-keep
                            |||||__ C event count
                            ||||___ R error rate
                            |||____ S speed/performance
                            ||_____ O updated online
                            |______ P prefailure warning

General Purpose Log Directory Version 1
SMART           Log Directory Version 1 [multi-sector log support]
Address    Access  R/W   Size  Description
0x00       GPL,SL  R/O      1  Log Directory
0x01           SL  R/O      1  Summary SMART error log
0x02           SL  R/O      5  Comprehensive SMART error log
0x03       GPL     R/O      5  Ext. Comprehensive SMART error log
0x04       GPL     R/O    256  Device Statistics log
0x04       SL      R/O      8  Device Statistics log
0x06           SL  R/O      1  SMART self-test log
0x07       GPL     R/O      1  Extended self-test log
0x08       GPL     R/O      2  Power Conditions log
0x09           SL  R/W      1  Selective self-test log
0x0a       GPL     R/W      8  Device Statistics Notification
0x0c       GPL     R/O   2048  Pending Defects log
0x10       GPL     R/O      1  NCQ Command Error log
0x11       GPL     R/O      1  SATA Phy Event Counters log
0x13       GPL     R/O      1  SATA NCQ Send and Receive log
0x21       GPL     R/O      1  Write stream error log
0x22       GPL     R/O      1  Read stream error log
0x24       GPL     R/O    768  Current Device Internal Status Data log
0x2f       GPL     R/O      1  Set Sector Configuration
0x30       GPL,SL  R/O      9  IDENTIFY DEVICE data log
0x80-0x9f  GPL,SL  R/W     16  Host vendor specific log
0xa1       GPL,SL  VS     160  Device vendor specific log
0xa2       GPL     VS   16320  Device vendor specific log
0xa4       GPL,SL  VS     160  Device vendor specific log
0xa6       GPL     VS     192  Device vendor specific log
0xa8-0xa9  GPL,SL  VS     136  Device vendor specific log
0xab       GPL     VS       1  Device vendor specific log
0xad       GPL     VS      16  Device vendor specific log
0xb1       GPL,SL  VS     160  Device vendor specific log
0xb6       GPL     VS    1920  Device vendor specific log
0xbe-0xbf  GPL     VS   65535  Device vendor specific log
0xc1       GPL,SL  VS       8  Device vendor specific log
0xc3       GPL,SL  VS      24  Device vendor specific log
0xc6       GPL     VS    5184  Device vendor specific log
0xc7       GPL,SL  VS       8  Device vendor specific log
0xc9       GPL,SL  VS       8  Device vendor specific log
0xca       GPL,SL  VS      16  Device vendor specific log
0xcd       GPL,SL  VS       1  Device vendor specific log
0xce       GPL     VS       1  Device vendor specific log
0xcf       GPL     VS     512  Device vendor specific log
0xd1       GPL     VS     656  Device vendor specific log
0xd2       GPL     VS   10256  Device vendor specific log
0xd4       GPL     VS    2048  Device vendor specific log
0xda       GPL,SL  VS       1  Device vendor specific log
0xe0       GPL,SL  R/W      1  SCT Command/Status
0xe1       GPL,SL  R/W      1  SCT Data Transfer

SMART Extended Comprehensive Error Log Version: 1 (5 sectors)
No Errors Logged

SMART Extended Self-test Log Version: 1 (1 sectors)
Num  Test_Description    Status                  Remaining  LifeTime(hours)  LBA_of_first_error
# 1  Extended offline    Completed without error       00%      2081         -
# 2  Short offline       Completed without error       00%      2068         -
# 3  Extended offline    Aborted by host               90%      2068         -
# 4  Extended offline    Aborted by host               90%      2068         -
# 5  Extended offline    Completed without error       00%      2050         -
# 6  Short offline       Completed without error       00%      2019         -
# 7  Extended offline    Completed without error       00%      1981         -
# 8  Extended offline    Interrupted (host reset)      90%      1970         -
# 9  Short offline       Completed without error       00%      1969         -

SMART Selective self-test log data structure revision number 1
 SPAN  MIN_LBA  MAX_LBA  CURRENT_TEST_STATUS
    1        0        0  Not_testing
    2        0        0  Not_testing
    3        0        0  Not_testing
    4        0        0  Not_testing
    5        0        0  Not_testing
Selective self-test flags (0x0):
  After scanning selected spans, do NOT read-scan remainder of disk.
If Selective self-test is pending on power-up, resume after 0 minute delay.

SCT Status Version:                  3
SCT Version (vendor specific):       522 (0x020a)
Device State:                        Active (0)
Current Temperature:                    46 Celsius
Power Cycle Min/Max Temperature:     42/50 Celsius
Lifetime    Min/Max Temperature:     25/51 Celsius
Under/Over Temperature Limit Count:   0/64
SMART Status:                        0xc24f (PASSED)
Vendor specific:
00 00 00 00 00 00 00 00 00 00 00 00 00 00 00 00
00 00 00 00 03 00 00 00 00 00 00 00 00 00 00 00

SCT Temperature History Version:     2
Temperature Sampling Period:         4 minutes
Temperature Logging Interval:        59 minutes
Min/Max recommended Temperature:     10/40 Celsius
Min/Max Temperature Limit:            5/60 Celsius
Temperature History Size (Index):    128 (90)

Index    Estimated Time   Temperature Celsius
  91    2025-08-22 05:22    43  ************************
 ...    ..(  5 skipped).    ..  ************************
  97    2025-08-22 11:16    43  ************************
  98    2025-08-22 12:15    48  *****************************
  99    2025-08-22 13:14    49  ******************************
 100    2025-08-22 14:13     ?  -
 101    2025-08-22 15:12    42  ***********************
 102    2025-08-22 16:11     ?  -
 103    2025-08-22 17:10    26  *******
 104    2025-08-22 18:09    48  *****************************
 105    2025-08-22 19:08    51  ********************************
 ...    ..(  5 skipped).    ..  ********************************
 111    2025-08-23 01:02    51  ********************************
 112    2025-08-23 02:01    50  *******************************
 ...    ..(  2 skipped).    ..  *******************************
 115    2025-08-23 04:58    50  *******************************
 116    2025-08-23 05:57    47  ****************************
 117    2025-08-23 06:56    46  ***************************
 118    2025-08-23 07:55    46  ***************************
 119    2025-08-23 08:54     ?  -
 120    2025-08-23 09:53    40  *********************
 121    2025-08-23 10:52     ?  -
 122    2025-08-23 11:51    25  ******
 123    2025-08-23 12:50    39  ********************
 124    2025-08-23 13:49    40  *********************
 125    2025-08-23 14:48    41  **********************
 ...    ..(  6 skipped).    ..  **********************
   4    2025-08-23 21:41    41  **********************
   5    2025-08-23 22:40    43  ************************
   6    2025-08-23 23:39    43  ************************
   7    2025-08-24 00:38    44  *************************
 ...    ..( 10 skipped).    ..  *************************
  18    2025-08-24 11:27    44  *************************
  19    2025-08-24 12:26    45  **************************
 ...    ..(  3 skipped).    ..  **************************
  23    2025-08-24 16:22    45  **************************
  24    2025-08-24 17:21    44  *************************
  25    2025-08-24 18:20    44  *************************
  26    2025-08-24 19:19     ?  -
  27    2025-08-24 20:18    44  *************************
  28    2025-08-24 21:17    45  **************************
  29    2025-08-24 22:16    44  *************************
 ...    ..( 17 skipped).    ..  *************************
  47    2025-08-25 15:58    44  *************************
  48    2025-08-25 16:57    49  ******************************
  49    2025-08-25 17:56    50  *******************************
  50    2025-08-25 18:55    50  *******************************
  51    2025-08-25 19:54    50  *******************************
  52    2025-08-25 20:53    49  ******************************
 ...    ..(  3 skipped).    ..  ******************************
  56    2025-08-26 00:49    49  ******************************
  57    2025-08-26 01:48    48  *****************************
  58    2025-08-26 02:47    48  *****************************
  59    2025-08-26 03:46    46  ***************************
  60    2025-08-26 04:45    44  *************************
 ...    ..(  9 skipped).    ..  *************************
  70    2025-08-26 14:35    44  *************************
  71    2025-08-26 15:34    45  **************************
  72    2025-08-26 16:33    45  **************************
  73    2025-08-26 17:32    44  *************************
  74    2025-08-26 18:31    44  *************************
  75    2025-08-26 19:30    44  *************************
  76    2025-08-26 20:29    45  **************************
  77    2025-08-26 21:28    44  *************************
  78    2025-08-26 22:27    44  *************************
  79    2025-08-26 23:26    44  *************************
  80    2025-08-27 00:25    49  ******************************
  81    2025-08-27 01:24    50  *******************************
  82    2025-08-27 02:23    50  *******************************
  83    2025-08-27 03:22    50  *******************************
  84    2025-08-27 04:21    49  ******************************
  85    2025-08-27 05:20    49  ******************************
  86    2025-08-27 06:19    49  ******************************
  87    2025-08-27 07:18    48  *****************************
 ...    ..(  2 skipped).    ..  *****************************
  90    2025-08-27 10:15    48  *****************************

SCT Error Recovery Control:
           Read:     70 (7.0 seconds)
          Write:     70 (7.0 seconds)

Device Statistics (GP Log 0x04)
Page  Offset Size        Value Flags Description
0x01  =====  =               =  ===  == General Statistics (rev 1) ==
0x01  0x008  4               6  ---  Lifetime Power-On Resets
0x01  0x010  4            2081  ---  Power-on Hours
0x01  0x018  6      4233556628  ---  Logical Sectors Written
0x01  0x020  6         6125038  ---  Number of Write Commands
0x01  0x028  6     50178402289  ---  Logical Sectors Read
0x01  0x030  6        80634821  ---  Number of Read Commands
0x01  0x038  6               -  ---  Date and Time TimeStamp
0x03  =====  =               =  ===  == Rotating Media Statistics (rev 1) ==
0x03  0x008  4            1877  ---  Spindle Motor Power-on Hours
0x03  0x010  4             677  ---  Head Flying Hours
0x03  0x018  4           17390  ---  Head Load Events
0x03  0x020  4               0  ---  Number of Reallocated Logical Sectors
0x03  0x028  4               0  ---  Read Recovery Attempts
0x03  0x030  4               0  ---  Number of Mechanical Start Failures
0x03  0x038  4               0  ---  Number of Realloc. Candidate Logical Sectors
0x03  0x040  4             160  ---  Number of High Priority Unload Events
0x04  =====  =               =  ===  == General Errors Statistics (rev 1) ==
0x04  0x008  4               0  ---  Number of Reported Uncorrectable Errors
0x04  0x010  4               0  ---  Resets Between Cmd Acceptance and Completion
0x04  0x018  4               0  -D-  Physical Element Status Changed
0x05  =====  =               =  ===  == Temperature Statistics (rev 1) ==
0x05  0x008  1              46  ---  Current Temperature
0x05  0x010  1              46  ---  Average Short Term Temperature
0x05  0x018  1              42  ---  Average Long Term Temperature
0x05  0x020  1              51  ---  Highest Temperature
0x05  0x028  1              30  ---  Lowest Temperature
0x05  0x030  1              47  ---  Highest Average Short Term Temperature
0x05  0x038  1              34  ---  Lowest Average Short Term Temperature
0x05  0x040  1              42  ---  Highest Average Long Term Temperature
0x05  0x048  1              37  ---  Lowest Average Long Term Temperature
0x05  0x050  4               0  ---  Time in Over-Temperature
0x05  0x058  1              60  ---  Specified Maximum Operating Temperature
0x05  0x060  4               0  ---  Time in Under-Temperature
0x05  0x068  1               5  ---  Specified Minimum Operating Temperature
0x06  =====  =               =  ===  == Transport Statistics (rev 1) ==
0x06  0x008  4              30  ---  Number of Hardware Resets
0x06  0x010  4               3  ---  Number of ASR Events
0x06  0x018  4               0  ---  Number of Interface CRC Errors
0xff  =====  =               =  ===  == Vendor Specific Statistics (rev 1) ==
0xff  0x010  7               0  ---  Vendor Specific
0xff  0x018  7               0  ---  Vendor Specific
                                |||_ C monitored condition met
                                ||__ D supports DSN
                                |___ N normalized value

Pending Defects log (GP Log 0x0c)
No Defects Logged

SATA Phy Event Counters (GP Log 0x11)
ID      Size     Value  Description
0x000a  2            2  Device-to-host register FISes sent due to a COMRESET
0x0001  2            0  Command failed due to ICRC error
0x0003  2            0  R_ERR response for device-to-host data FIS
0x0004  2            0  R_ERR response for host-to-device data FIS
0x0006  2            0  R_ERR response for device-to-host non-data FIS
0x0007  2            0  R_ERR response for host-to-device non-data FIS

Seagate FARM log (GP Log 0xa6) supported [try: -l farm]
Conclusion: there must have something going on the truenas core server and most likely I should have done more testing on that plattform before replacing the drive. Anyway, that’s not a big deal, since I will use this drive as a spare part for the next hdd breaking down.
Thanks everyone for your support.
Mine only comes out to about 1.3 per day, and probably less if you remove my initial testing period and total reboots, which really comes out to less than 1 per day.
@macx979 is hitting 40 to 50 per day on some drives.