My ‘Power On Hours’ has been replaced by ‘Power On Hours Ago’ when I view SMART test results.
How do I get ‘Power On Hours’ instead?
You are going to need to be much more specific that that. What is reporting “Power On Hours Ago”? Post the entire output of smartctl -x /dev/sda (sda being the drive in question).
1 Like


I’m sure it used to default to Power On Hours. This Power On Hours Ago isn’t helpful to me and I can’t see a way to switch it back?
I am seeing the same on Fangtooth 25.04.1. It may have been different in a previous Fangtooth or other Scale verison
Screenshot with the columns options

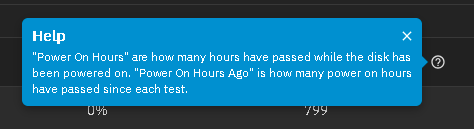
EDIT: not sure if this would be considered a Feedback issue or a Bug issue. Tooltip showing both but it isn’t a Column choice for display. Either way, it probably should get submitted to iX Systems
I looked at a Goldeneye VM in VirtualBox and there wasn’t an option to look at SMART results. Since that is a nightly, I didn’t know if it was just missing or maybe moved to a different location. The VMs don’t behave the same as bare metal so it may be just that and SMART tests.
1 Like
The “Power On Hours Ago” could be part of what iXsystems is considering some adaptive SMART testing that they plan to bring in. This could be the beginning steps. But they did not release any details on how this adaptive scheduling would work, what the deciding factors are. To me, that is important information to have. Maybe I will agree with the specs they use, maybe I will not.
I have not seen that message as I do not use TrueNAS to run my SMART testing.
That is my best guess.
EDIT: What is SMART Test Results of “slow”? Please tell me it is the name of your pool and not what iXsystems is calling Short testing.
I don’t know how @chri5 got ‘slow’ on that screenshot but I believe it to be the pool name. You can expand the system details and see the pools refered to as fast and slow.
Put in a Bug report since tool tip mentioned both Power On Hours and Power On Hours Ago. We will have to see if this is a Bug or a Feature.
1 Like
Yes it’s my pool name ‘slow’ I have another called ‘fast’.
TrueNAS Jira say this isn’t a bug or a regression in functionality. I’d say it is. ![]()
In case you didn’t see
Looks like this still hasn’t been fixed in the latest update. I don’t see value in ‘Power On Hours Ago’ which only tells you how many hours have past since the last test. ‘Power On Hours’ however tells you how long your disk has been running.
I just looked at the ticket NAS-136478 and it is showing the fix is in 26.04 BETA-1 (Halfmoon).
That would be next year sometime. 25.10 is due, approximately, October.
It’s best to look at the linked tickets, if you can
1 Like
Didn’t read the whole thread in detail
Chiming in to say I really don’t like this “power on hours ago” column without a companion “power on hours” like it used to be. Looks like maybe this is being fixed in a coming version, so my commentary here is likely moot.
I’m relatively certain this change came in 25.04.x but I’m too lazy to revert to an old boot env to verify.
This could easily just be a bug/compatibility issue with this disk’s firmware or something, but tell me if this makes any logical sense? I can assure that test was not started 2^16 hours ago.

Smartctl output definitely disagrees with whatever the UI seems to think.
root@REDACTED[~]# smartctl -a /dev/sdb
smartctl 7.4 2023-08-01 r5530 [x86_64-linux-6.12.15-production+truenas] (local build)
Copyright (C) 2002-23, Bruce Allen, Christian Franke, www.smartmontools.org

=== START OF INFORMATION SECTION ===
Model Family:     Seagate Enterprise Capacity 3.5 HDD
Device Model:     ST8000NM0055-1RM112
Serial Number:    REDACTED
LU WWN Device Id: 5 000c50 0914084c3
Firmware Version: SN02
User Capacity:    8,001,563,222,016 bytes [8.00 TB]
Sector Sizes:     512 bytes logical, 4096 bytes physical
Rotation Rate:    7200 rpm
Form Factor:      3.5 inches
Device is:        In smartctl database 7.3/5804
ATA Version is:   ACS-3 T13/2161-D revision 5
SATA Version is:  SATA 3.1, 6.0 Gb/s (current: 3.0 Gb/s)
Local Time is:    Sun Aug  3 11:22:52 2025 CDT
SMART support is: Available - device has SMART capability.
SMART support is: Enabled

=== START OF READ SMART DATA SECTION ===
SMART overall-health self-assessment test result: PASSED

General SMART Values:
Offline data collection status:  (0x82) Offline data collection activity
                                        was completed without error.
                                        Auto Offline Data Collection: Enabled.
Self-test execution status:      ( 243) Self-test routine in progress...
                                        30% of test remaining.

--- OUTPUT SKIPPED ---

SMART Self-test log structure revision number 1
Num  Test_Description    Status                  Remaining  LifeTime(hours)  LBA_of_first_error
# 1  Extended offline    Self-test routine in progress 30%     11709         -
# 2  Short offline       Completed without error       00%     11681         -
# 3  Short offline       Completed without error       00%     11668         -
# 4  Short offline       Completed without error       00%     11665         -
# 5  Short offline       Completed without error       00%     11649         -
# 6  Short offline       Completed without error       00%     11633         -
# 7  Short offline       Completed without error       00%     11617         -
# 8  Short offline       Completed without error       00%     11601         -
# 9  Extended offline    Completed without error       00%     11585         -
Things definitely didn’t look this way in previous versions (again, I think it was fine in 24.10.x).
You might want to create use the Report a Bug in the TrueNAS GUI. Upper right, looks like a smile for Feedback / Report a Bug. Include a debug dump along with your screenshot and your smartclt results. Mine doesn’t look like that and yours appears to be counting backwards or something for Power On Hours Ago
I think the change came with Fangtooth 25.04.
Assuming your response is to me. Already did yesterday (don’t think I included debug though) but after seeing it again during my normal weekly system checks I figured I’d see if there was a thread here already.