Hi,
I have the following errors/problems, should I replace the disk ? Otherwise, should I be concerned about it ? What would you suggest ? All the disks are 1 year old.

Thanks you for your time !
Hi,
I have the following errors/problems, should I replace the disk ? Otherwise, should I be concerned about it ? What would you suggest ? All the disks are 1 year old.
Thanks you for your time !
It all looks like the drive is due for RMA: Failing self-tests and excessive number of failed or dubious sectors.
sudo smartctl -x /dev/sda to confirm.
Please post the output between two lines of three backquotes or use the </> button.
```
smartctl output
```
I can’t RMA this drive, but I have a replacement disk in stock, if needed.
Here is the output :
smartctl 7.4 2023-08-01 r5530 [x86_64-linux-6.6.32-production+truenas] (local build)
Copyright (C) 2002-23, Bruce Allen, Christian Franke, www.smartmontools.org

=== START OF INFORMATION SECTION ===
Model Family:     Toshiba MG10ACA... Enterprise Capacity HDD
Device Model:     TOSHIBA MG10ACA20TE
Serial Number:    73D0A1LEF4MJ
LU WWN Device Id: 5 000039 ca8c8cd5f
Firmware Version: 0102
User Capacity:    20,000,588,955,648 bytes [20.0 TB]
Sector Sizes:     512 bytes logical, 4096 bytes physical
Rotation Rate:    7200 rpm
Form Factor:      3.5 inches
Device is:        In smartctl database 7.3/5528
ATA Version is:   ACS-4 T13/BSR INCITS 529 revision 5
SATA Version is:  SATA 3.3, 6.0 Gb/s (current: 6.0 Gb/s)
Local Time is:    Sun Mar 16 19:02:13 2025 CET
SMART support is: Available - device has SMART capability.
SMART support is: Enabled
AAM feature is:   Unavailable
APM feature is:   Disabled
Rd look-ahead is: Enabled
Write cache is:   Enabled
DSN feature is:   Disabled
ATA Security is:  Disabled, NOT FROZEN [SEC1]
Wt Cache Reorder: Enabled

=== START OF READ SMART DATA SECTION ===
SMART overall-health self-assessment test result: PASSED

General SMART Values:
Offline data collection status:  (0x86) Offline data collection activity
                                        was aborted by the device with a fatal error.
                                        Auto Offline Data Collection: Enabled.
Self-test execution status:      (   0) The previous self-test routine completed
                                        without error or no self-test has ever
                                        been run.
Total time to complete Offline
data collection:                (  120) seconds.
Offline data collection
capabilities:                    (0x5b) SMART execute Offline immediate.
                                        Auto Offline data collection on/off support.
                                        Suspend Offline collection upon new
                                        command.
                                        Offline surface scan supported.
                                        Self-test supported.
                                        No Conveyance Self-test supported.
                                        Selective Self-test supported.
SMART capabilities:            (0x0003) Saves SMART data before entering
                                        power-saving mode.
                                        Supports SMART auto save timer.
Error logging capability:        (0x01) Error logging supported.
                                        General Purpose Logging supported.
Short self-test routine
recommended polling time:        (   2) minutes.
Extended self-test routine
recommended polling time:        (1668) minutes.
SCT capabilities:              (0x003d) SCT Status supported.
                                        SCT Error Recovery Control supported.
                                        SCT Feature Control supported.
                                        SCT Data Table supported.

SMART Attributes Data Structure revision number: 16
Vendor Specific SMART Attributes with Thresholds:
ID# ATTRIBUTE_NAME          FLAGS    VALUE WORST THRESH FAIL RAW_VALUE
  1 Raw_Read_Error_Rate     PO-R--   100   085   050    -    0
  2 Throughput_Performance  P-S---   100   100   050    -    0
  3 Spin_Up_Time            POS--K   100   100   001    -    9670
  4 Start_Stop_Count        -O--CK   100   100   000    -    100
  5 Reallocated_Sector_Ct   PO--CK   098   098   010    -    273
  7 Seek_Error_Rate         PO-R--   100   100   050    -    0
  8 Seek_Time_Performance   P-S---   100   100   050    -    0
  9 Power_On_Hours          -O--CK   076   076   000    -    9828
 10 Spin_Retry_Count        PO--CK   100   100   030    -    0
 12 Power_Cycle_Count       -O--CK   100   100   000    -    100
 23 Helium_Condition_Lower  PO---K   100   100   075    -    0
 24 Helium_Condition_Upper  PO---K   100   082   075    -    0
 27 MAMR_Health_Monitor     PO---K   100   100   030    -    592950
191 G-Sense_Error_Rate      -O--CK   100   100   000    -    3
192 Power-Off_Retract_Count -O--CK   100   100   000    -    99
193 Load_Cycle_Count        -O--CK   100   100   000    -    110
194 Temperature_Celsius     -O---K   100   100   000    -    38 (Min/Max 14/56)
196 Reallocated_Event_Count PO--CK   098   098   010    -    137
197 Current_Pending_Sector  -O--CK   100   100   000    -    213
198 Offline_Uncorrectable   ----CK   100   100   000    -    210
199 UDMA_CRC_Error_Count    -O--CK   200   200   000    -    0
220 Disk_Shift              -O----   100   100   000    -    786432
222 Loaded_Hours            -O--CK   076   076   000    -    9819
226 Load-in_Time            -OS--K   100   100   000    -    688
240 Head_Flying_Hours       P-----   100   100   001    -    0
241 Total_LBAs_Written      -O--CK   100   100   000    -    125144518296
242 Total_LBAs_Read         -O--CK   100   100   000    -    338965885421
                            ||||||_ K auto-keep
                            |||||__ C event count
                            ||||___ R error rate
                            |||____ S speed/performance
                            ||_____ O updated online
                            |______ P prefailure warning

General Purpose Log Directory Version 1
SMART           Log Directory Version 1 [multi-sector log support]
Address    Access  R/W   Size  Description
0x00       GPL,SL  R/O      1  Log Directory
0x01           SL  R/O      1  Summary SMART error log
0x02           SL  R/O     51  Comprehensive SMART error log
0x03       GPL     R/O      5  Ext. Comprehensive SMART error log
0x04       GPL,SL  R/O      8  Device Statistics log
0x06           SL  R/O      1  SMART self-test log
0x07       GPL     R/O      1  Extended self-test log
0x08       GPL     R/O      2  Power Conditions log
0x09           SL  R/W      1  Selective self-test log
0x0a       GPL     R/W      2  Device Statistics Notification
0x0c       GPL     R/O    513  Pending Defects log
0x10       GPL     R/O      1  NCQ Command Error log
0x11       GPL     R/O      1  SATA Phy Event Counters log
0x24       GPL     R/O  65520  Current Device Internal Status Data log
0x25       GPL     R/O  65520  Saved Device Internal Status Data log
0x2f       GPL     R/O      1  Set Sector Configuration
0x30       GPL,SL  R/O      9  IDENTIFY DEVICE data log
0x80-0x9f  GPL,SL  R/W     16  Host vendor specific log
0xab       GPL     VS    1024  Device vendor specific log
0xae       GPL     VS      25  Device vendor specific log
0xe0       GPL,SL  R/W      1  SCT Command/Status
0xe1       GPL,SL  R/W      1  SCT Data Transfer

SMART Extended Comprehensive Error Log Version: 1 (5 sectors)
Device Error Count: 9
        CR     = Command Register
        FEATR  = Features Register
        COUNT  = Count (was: Sector Count) Register
        LBA_48 = Upper bytes of LBA High/Mid/Low Registers ]  ATA-8
        LH     = LBA High (was: Cylinder High) Register    ]   LBA
        LM     = LBA Mid (was: Cylinder Low) Register      ] Register
        LL     = LBA Low (was: Sector Number) Register     ]
        DV     = Device (was: Device/Head) Register
        DC     = Device Control Register
        ER     = Error register
        ST     = Status register
Powered_Up_Time is measured from power on, and printed as
DDd+hh:mm:SS.sss where DD=days, hh=hours, mm=minutes,
SS=sec, and sss=millisec. It "wraps" after 49.710 days.

Error 9 [8] occurred at disk power-on lifetime: 9739 hours (405 days + 19 hours)
  When the command that caused the error occurred, the device was active or idle.

  After command completion occurred, registers were:
  ER -- ST COUNT  LBA_48  LH LM LL DV DC
  -- -- -- == -- == == == -- -- -- -- --
  40 -- 43 00 00 00 09 15 d1 af 10 40 00  Error: UNC at LBA = 0x915d1af10 = 39020769040

  Commands leading to the command that caused the error were:
  CR FEATR COUNT  LBA_48  LH LM LL DV DC  Powered_Up_Time  Command/Feature_Name
  -- == -- == -- == == == -- -- -- -- --  ---------------  --------------------
  60 05 70 00 00 00 09 15 d1 ab 30 40 00  1d+17:10:48.967  READ FPDMA QUEUED
  60 07 b8 00 40 00 09 15 d1 a3 48 40 00  1d+17:10:48.954  READ FPDMA QUEUED
  61 00 08 00 38 00 03 01 dd 23 98 40 00  1d+17:10:48.954  WRITE FPDMA QUEUED
  61 00 10 00 30 00 00 00 00 12 10 40 00  1d+17:10:48.954  WRITE FPDMA QUEUED
  61 00 10 00 28 00 09 18 5f f6 10 40 00  1d+17:10:48.954  WRITE FPDMA QUEUED

Error 8 [7] occurred at disk power-on lifetime: 9739 hours (405 days + 19 hours)
  When the command that caused the error occurred, the device was in standby mode.

  After command completion occurred, registers were:
  ER -- ST COUNT  LBA_48  LH LM LL DV DC
  -- -- -- == -- == == == -- -- -- -- --
  40 -- 43 00 00 00 09 15 d1 98 50 40 00  Error: WP at LBA = 0x915d19850 = 39020763216

  Commands leading to the command that caused the error were:
  CR FEATR COUNT  LBA_48  LH LM LL DV DC  Powered_Up_Time  Command/Feature_Name
  -- == -- == -- == == == -- -- -- -- --  ---------------  --------------------
  61 00 08 00 18 00 03 01 c0 8a f8 40 00  1d+17:10:47.280  WRITE FPDMA QUEUED
  60 00 28 00 10 00 09 15 d1 9b 08 40 00  1d+17:10:45.247  READ FPDMA QUEUED
  60 00 28 00 08 00 09 15 d1 9a d8 40 00  1d+17:10:45.247  READ FPDMA QUEUED
  60 02 a0 00 00 00 09 15 d1 98 08 40 00  1d+17:10:45.247  READ FPDMA QUEUED
  60 00 28 00 10 00 09 15 d1 97 b0 40 00  1d+17:10:45.243  READ FPDMA QUEUED

Error 7 [6] occurred at disk power-on lifetime: 9597 hours (399 days + 21 hours)
  When the command that caused the error occurred, the device was in standby mode.

  After command completion occurred, registers were:
  ER -- ST COUNT  LBA_48  LH LM LL DV DC
  -- -- -- == -- == == == -- -- -- -- --
  40 -- 43 00 00 00 04 b0 fe 0f e8 40 00  Error: UNC at LBA = 0x4b0fe0fe8 = 20149309416

  Commands leading to the command that caused the error were:
  CR FEATR COUNT  LBA_48  LH LM LL DV DC  Powered_Up_Time  Command/Feature_Name
  -- == -- == -- == == == -- -- -- -- --  ---------------  --------------------
  60 02 48 00 18 00 04 b0 c5 1d 88 40 00 12d+18:01:24.301  READ FPDMA QUEUED
  60 00 e0 00 10 00 06 dd bb 0c 78 40 00 12d+18:01:22.230  READ FPDMA QUEUED
  60 01 38 00 08 00 06 dd bb 0a e0 40 00 12d+18:01:22.230  READ FPDMA QUEUED
  60 02 a0 00 00 00 04 b0 fe 0e 88 40 00 12d+18:01:22.229  READ FPDMA QUEUED
  60 01 90 00 08 00 04 b0 fc e3 e0 40 00 12d+18:01:22.229  READ FPDMA QUEUED

Error 6 [5] occurred at disk power-on lifetime: 9203 hours (383 days + 11 hours)
  When the command that caused the error occurred, the device was active or idle.

  After command completion occurred, registers were:
  ER -- ST COUNT  LBA_48  LH LM LL DV DC
  -- -- -- == -- == == == -- -- -- -- --
  40 -- 43 00 00 00 03 23 f9 37 a0 40 00  Error: WP at LBA = 0x323f937a0 = 13488437152

  Commands leading to the command that caused the error were:
  CR FEATR COUNT  LBA_48  LH LM LL DV DC  Powered_Up_Time  Command/Feature_Name
  -- == -- == -- == == == -- -- -- -- --  ---------------  --------------------
  61 00 30 00 18 00 06 7a 2f fe 48 40 00 46d+01:10:02.232  WRITE FPDMA QUEUED
  60 00 28 00 00 00 03 23 f9 37 a0 40 00 46d+01:10:02.232  READ FPDMA QUEUED
  61 00 08 00 10 00 03 01 c3 1e 48 40 00 46d+01:10:02.232  WRITE FPDMA QUEUED
  61 00 28 00 08 00 06 7a 2f fe 20 40 00 46d+01:10:02.231  WRITE FPDMA QUEUED
  61 00 30 00 00 00 06 7a 2f fd f0 40 00 46d+01:10:02.231  WRITE FPDMA QUEUED

Error 5 [4] occurred at disk power-on lifetime: 9182 hours (382 days + 14 hours)
  When the command that caused the error occurred, the device was active or idle.

  After command completion occurred, registers were:
  ER -- ST COUNT  LBA_48  LH LM LL DV DC
  -- -- -- == -- == == == -- -- -- -- --
  40 -- 43 00 30 00 04 84 03 07 30 40 00  Error: WP at LBA = 0x484030730 = 19394660144

  Commands leading to the command that caused the error were:
  CR FEATR COUNT  LBA_48  LH LM LL DV DC  Powered_Up_Time  Command/Feature_Name
  -- == -- == -- == == == -- -- -- -- --  ---------------  --------------------
  61 00 88 00 08 00 06 03 d4 76 80 40 00 45d+03:54:46.715  WRITE FPDMA QUEUED
  61 00 30 00 00 00 06 03 d4 76 10 40 00 45d+03:54:46.715  WRITE FPDMA QUEUED
  61 00 58 00 08 00 06 03 d4 75 58 40 00 45d+03:54:46.710  WRITE FPDMA QUEUED
  61 00 28 00 00 00 06 03 d4 74 e0 40 00 45d+03:54:46.710  WRITE FPDMA QUEUED
  60 01 60 00 50 00 04 84 03 62 28 40 00 45d+03:54:46.709  READ FPDMA QUEUED

Error 4 [3] occurred at disk power-on lifetime: 9182 hours (382 days + 14 hours)
  When the command that caused the error occurred, the device was active or idle.

  After command completion occurred, registers were:
  ER -- ST COUNT  LBA_48  LH LM LL DV DC
  -- -- -- == -- == == == -- -- -- -- --
  40 -- 43 00 20 00 04 84 03 07 60 40 00  Error: UNC at LBA = 0x484030760 = 19394660192

  Commands leading to the command that caused the error were:
  CR FEATR COUNT  LBA_48  LH LM LL DV DC  Powered_Up_Time  Command/Feature_Name
  -- == -- == -- == == == -- -- -- -- --  ---------------  --------------------
  60 00 30 00 48 00 04 84 03 55 a8 40 00 45d+03:54:43.356  READ FPDMA QUEUED
  60 00 10 00 40 00 00 00 00 12 10 40 00 45d+03:54:43.356  READ FPDMA QUEUED
  60 00 10 00 38 00 09 18 5f f6 10 40 00 45d+03:54:43.356  READ FPDMA QUEUED
  60 00 10 00 30 00 09 18 5f f4 10 40 00 45d+03:54:43.356  READ FPDMA QUEUED
  60 00 b0 00 28 00 04 84 03 07 08 40 00 45d+03:54:43.356  READ FPDMA QUEUED

Error 3 [2] occurred at disk power-on lifetime: 9182 hours (382 days + 14 hours)
  When the command that caused the error occurred, the device was active or idle.

  After command completion occurred, registers were:
  ER -- ST COUNT  LBA_48  LH LM LL DV DC
  -- -- -- == -- == == == -- -- -- -- --
  40 -- 43 00 00 00 04 84 03 06 b0 40 00  Error: UNC at LBA = 0x4840306b0 = 19394660016

  Commands leading to the command that caused the error were:
  CR FEATR COUNT  LBA_48  LH LM LL DV DC  Powered_Up_Time  Command/Feature_Name
  -- == -- == -- == == == -- -- -- -- --  ---------------  --------------------
  60 00 10 00 38 00 00 00 00 12 10 40 00 45d+03:54:40.732  READ FPDMA QUEUED
  60 00 10 00 30 00 09 18 5f f6 10 40 00 45d+03:54:40.732  READ FPDMA QUEUED
  60 00 10 00 28 00 09 18 5f f4 10 40 00 45d+03:54:40.732  READ FPDMA QUEUED
  60 00 b0 00 20 00 04 84 03 07 08 40 00 45d+03:54:40.732  READ FPDMA QUEUED
  60 00 30 00 18 00 04 84 03 07 60 40 00 45d+03:54:40.732  READ FPDMA QUEUED

Error 2 [1] occurred at disk power-on lifetime: 9182 hours (382 days + 14 hours)
  When the command that caused the error occurred, the device was active or idle.

  After command completion occurred, registers were:
  ER -- ST COUNT  LBA_48  LH LM LL DV DC
  -- -- -- == -- == == == -- -- -- -- --
  40 -- 43 00 00 00 04 84 03 06 a8 40 00  Error: UNC at LBA = 0x4840306a8 = 19394660008

  Commands leading to the command that caused the error were:
  CR FEATR COUNT  LBA_48  LH LM LL DV DC  Powered_Up_Time  Command/Feature_Name
  -- == -- == -- == == == -- -- -- -- --  ---------------  --------------------
  60 00 28 00 10 00 04 84 03 06 b0 40 00 45d+03:54:36.429  READ FPDMA QUEUED
  60 00 30 00 08 00 04 84 03 07 60 40 00 45d+03:54:36.429  READ FPDMA QUEUED
  60 00 30 00 00 00 04 84 03 06 80 40 00 45d+03:54:36.429  READ FPDMA QUEUED
  61 00 18 00 00 00 03 01 da c5 50 40 00 45d+03:54:36.417  WRITE FPDMA QUEUED
  60 00 28 00 00 00 04 84 03 06 28 40 00 45d+03:54:36.413  READ FPDMA QUEUED

SMART Extended Self-test Log Version: 1 (1 sectors)
Num  Test_Description    Status                  Remaining  LifeTime(hours)  LBA_of_first_error
# 1  Short offline       Completed without error       00%      9809         -
# 2  Short offline       Completed without error       00%      9785         -
# 3  Extended offline    Completed: read failure       10%      9763         9969348944
# 4  Extended offline    Completed: read failure       10%      9692         9969348944
# 5  Short offline       Completed without error       00%      9665         -
# 6  Short offline       Completed without error       00%      9641         -
# 7  Short offline       Completed without error       00%      9617         -
# 8  Short offline       Completed without error       00%      9593         -
# 9  Extended offline    Completed without error       00%      9575         -
#10  Short offline       Completed without error       00%      8249         -
#11  Short offline       Completed without error       00%      8225         -
#12  Short offline       Completed without error       00%      8201         -
#13  Short offline       Completed without error       00%      8177         -
#14  Short offline       Completed without error       00%      8153         -
#15  Short offline       Completed without error       00%      8129         -
#16  Short offline       Completed without error       00%      8105         -
#17  Short offline       Completed without error       00%      8081         -
#18  Short offline       Completed without error       00%      8057         -
#19  Short offline       Completed without error       00%      8033         -

SMART Selective self-test log data structure revision number 1
 SPAN  MIN_LBA  MAX_LBA  CURRENT_TEST_STATUS
    1        0        0  Not_testing
    2        0        0  Not_testing
    3        0        0  Not_testing
    4        0        0  Not_testing
    5        0        0  Not_testing
Selective self-test flags (0x0):
  After scanning selected spans, do NOT read-scan remainder of disk.
If Selective self-test is pending on power-up, resume after 0 minute delay.

SCT Status Version:                  3
SCT Version (vendor specific):       1 (0x0001)
Device State:                        Active (0)
Current Temperature:                    38 Celsius
Power Cycle Min/Max Temperature:     37/46 Celsius
Lifetime    Min/Max Temperature:     14/56 Celsius
Specified Max Operating Temperature:    60 Celsius
Under/Over Temperature Limit Count:   0/0
SMART Status:                        0xc24f (PASSED)
Vendor specific:
00 00 02 00 00 00 00 00 00 00 00 00 00 00 00 00
00 00 00 00 00 00 00 00 00 00 00 00 00 00 00 00

SCT Temperature History Version:     2
Temperature Sampling Period:         1 minute
Temperature Logging Interval:        1 minute
Min/Max recommended Temperature:     10/40 Celsius
Min/Max Temperature Limit:            5/60 Celsius
Temperature History Size (Index):    478 (207)

Index    Estimated Time   Temperature Celsius
 208    2025-03-16 11:05    38  *******************
 ...    ..(190 skipped).    ..  *******************
 399    2025-03-16 14:16    38  *******************
 400    2025-03-16 14:17    37  ******************
 ...    ..( 59 skipped).    ..  ******************
 460    2025-03-16 15:17    37  ******************
 461    2025-03-16 15:18    38  *******************
 ...    ..( 23 skipped).    ..  *******************
   7    2025-03-16 15:42    38  *******************
   8    2025-03-16 15:43    37  ******************
   9    2025-03-16 15:44    38  *******************
 ...    ..(182 skipped).    ..  *******************
 192    2025-03-16 18:47    38  *******************
 193    2025-03-16 18:48    39  ********************
 194    2025-03-16 18:49    38  *******************
 195    2025-03-16 18:50    39  ********************
 ...    ..(  3 skipped).    ..  ********************
 199    2025-03-16 18:54    39  ********************
 200    2025-03-16 18:55    38  *******************
 ...    ..(  6 skipped).    ..  *******************
 207    2025-03-16 19:02    38  *******************

SCT Error Recovery Control:
           Read: Disabled
          Write: Disabled

Device Statistics (GP Log 0x04)
Page  Offset Size        Value Flags Description
0x01  =====  =               =  ===  == General Statistics (rev 3) ==
0x01  0x008  4             100  ---  Lifetime Power-On Resets
0x01  0x010  4            9828  ---  Power-on Hours
0x01  0x018  6    125144518296  ---  Logical Sectors Written
0x01  0x020  6      1627638644  ---  Number of Write Commands
0x01  0x028  6    338965885421  ---  Logical Sectors Read
0x01  0x030  6      2388773257  ---  Number of Read Commands
0x01  0x038  6     35380800000  ---  Date and Time TimeStamp
0x01  0x040  4            1704  ---  Pending Error Count
0x02  =====  =               =  ===  == Free-Fall Statistics (rev 1) ==
0x02  0x010  4               3  ---  Overlimit Shock Events
0x03  =====  =               =  ===  == Rotating Media Statistics (rev 1) ==
0x03  0x008  4             283  ---  Spindle Motor Power-on Hours
0x03  0x010  4             274  ---  Head Flying Hours
0x03  0x018  4             110  ---  Head Load Events
0x03  0x020  4            2184  ---  Number of Reallocated Logical Sectors
0x03  0x028  4           15264  ---  Read Recovery Attempts
0x03  0x030  4               0  ---  Number of Mechanical Start Failures
0x03  0x038  4            1704  ---  Number of Realloc. Candidate Logical Sectors
0x03  0x040  4              99  ---  Number of High Priority Unload Events
0x04  =====  =               =  ===  == General Errors Statistics (rev 1) ==
0x04  0x008  4               9  ---  Number of Reported Uncorrectable Errors
0x04  0x010  4               0  ---  Resets Between Cmd Acceptance and Completion
0x04  0x018  4               0  -D-  Physical Element Status Changed
0x05  =====  =               =  ===  == Temperature Statistics (rev 1) ==
0x05  0x008  1              38  ---  Current Temperature
0x05  0x010  1              38  N--  Average Short Term Temperature
0x05  0x018  1              41  N--  Average Long Term Temperature
0x05  0x020  1              56  ---  Highest Temperature
0x05  0x028  1              14  ---  Lowest Temperature
0x05  0x030  1              53  N--  Highest Average Short Term Temperature
0x05  0x038  1              33  N--  Lowest Average Short Term Temperature
0x05  0x040  1              46  N--  Highest Average Long Term Temperature
0x05  0x048  1              39  N--  Lowest Average Long Term Temperature
0x05  0x050  4               0  ---  Time in Over-Temperature
0x05  0x058  1              60  ---  Specified Maximum Operating Temperature
0x05  0x060  4               0  ---  Time in Under-Temperature
0x05  0x068  1               5  ---  Specified Minimum Operating Temperature
0x06  =====  =               =  ===  == Transport Statistics (rev 1) ==
0x06  0x008  4             227  ---  Number of Hardware Resets
0x06  0x010  4             187  ---  Number of ASR Events
0x06  0x018  4               0  ---  Number of Interface CRC Errors
0x07  =====  =               =  ===  == Solid State Device Statistics (rev 1) ==
                                |||_ C monitored condition met
                                ||__ D supports DSN
                                |___ N normalized value

Pending Defects log (GP Log 0x0c)
Index                LBA    Hours
    0         9969348944     9661
    1         9969348945     9661
    2         9969348946     9661
    3         9969348947     9661
    4         9969348948     9661
    5         9969348949     9661
    6         9969348950     9661
    7         9969348951     9661
    8         9969348960     9661
    9         9969348961     9661
   10         9969348962     9661
   11         9969348963     9661
   12         9969348964     9661
   13         9969348965     9661
   14         9969348966     9661
   15         9969348967     9661
   16         9969348968     9661
   17         9969348969     9661
   18         9969348970     9661
   19         9969348971     9661
   20         9969348972     9661
   21         9969348973     9661
   22         9969348974     9661
   23         9969348975     9661
   24         9969348976     9661
   25         9969348977     9661
   26         9969348978     9661
   27         9969348979     9661
   28         9969348980     9661
   29         9969348981     9661
   30         9969348982     9661
... (1673 entries not shown)

SATA Phy Event Counters (GP Log 0x11)
ID      Size     Value  Description
0x0001  4            0  Command failed due to ICRC error
0x0002  4            0  R_ERR response for data FIS
0x0003  4            0  R_ERR response for device-to-host data FIS
0x0004  4            0  R_ERR response for host-to-device data FIS
0x0005  4            0  R_ERR response for non-data FIS
0x0006  4            0  R_ERR response for device-to-host non-data FIS
0x0007  4            0  R_ERR response for host-to-device non-data FIS
0x0008  4            0  Device-to-host non-data FIS retries
0x0009  4            0  Transition from drive PhyRdy to drive PhyNRdy
0x000a  4            0  Device-to-host register FISes sent due to a COMRESET
0x000b  4            0  CRC errors within host-to-device FIS
0x000d  4            0  Non-CRC errors within host-to-device FIS
0x000f  4            0  R_ERR response for host-to-device data FIS, CRC
0x0010  4            0  R_ERR response for host-to-device data FIS, non-CRC
0x0012  4            0  R_ERR response for host-to-device non-data FIS, CRC
0x0013  4            0  R_ERR response for host-to-device non-data FIS, non-CRC
FYI: In my custom NAS and in my UNAS, I am running WD Red Pro SSDs. Rock solid for over 3 years. In my UI NVR, I am using WD Ultrastar DC HC530 WUH721414ALE6L4 14TB 7.2K RPM SATA 6Gb/s Manufacturer Recertified HDD. So far rock solid but they have only been running for 3 months.
@WoisWoi
That drive is about dead.
Two quick indications:
5 Reallocated_Sector_Ct   PO--CK   098   098   010    -    273
# 3  Extended offline    Completed: read failure       10%      9763         9969348944
So should I replace it ASAP ? Or should I wait until he’s “really” dead ?
That is entirely up to you.
I would replace it sooner than later. The letter “P” in the Reallocated Sector Ct stands for “Pre-failure”. The fact that the drive cannot read portions of the drive surface during a Read Test is also a clear indicator of failure. Either one results in drive replacement and you have both.
All right, thanks a lot for your help and time !
Hi,
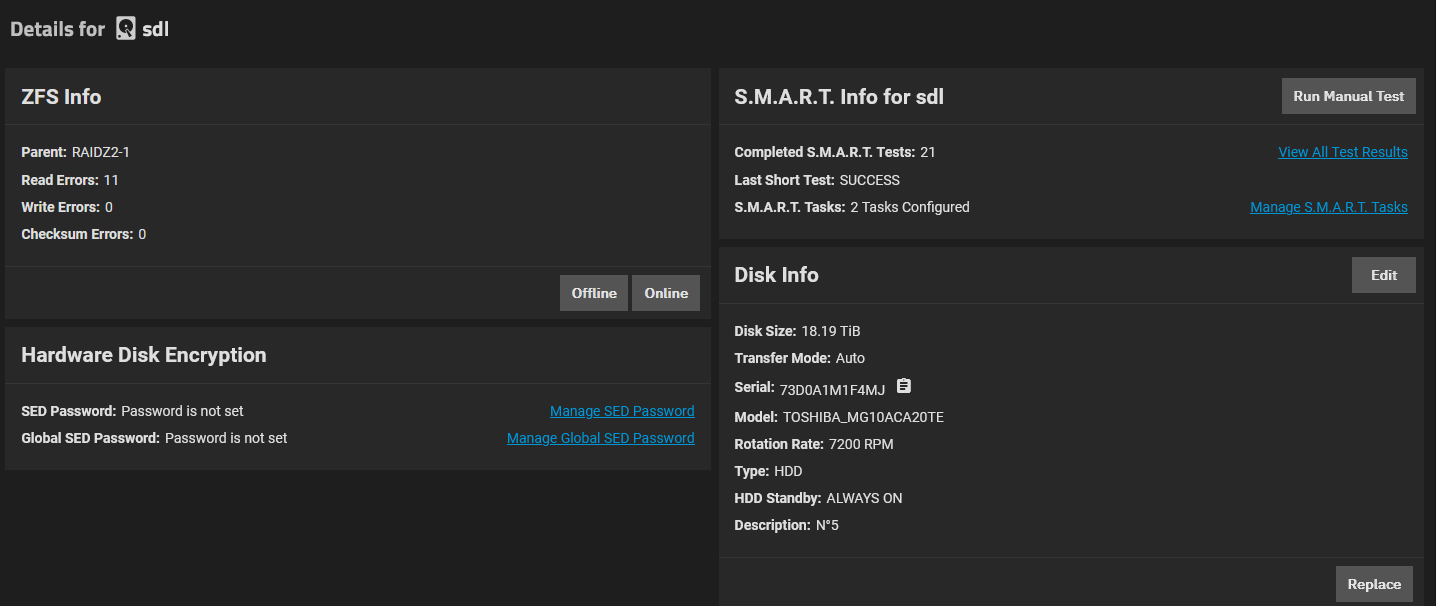
I have a new disk with error ![]()
I had this error :
Device: /dev/sdl [SAT], 2 Currently unreadable (pending) sectors.
All short tests succeeded.
There is the output of smartctl -x /dev/sdl :
=== START OF INFORMATION SECTION ===
Model Family:     Toshiba MG10ACA... Enterprise Capacity HDD
Device Model:     TOSHIBA MG10ACA20TE
Serial Number:    73D0A1M1F4MJ
LU WWN Device Id: 5 000039 ca8c8cd76
Firmware Version: 0102
User Capacity:    20,000,588,955,648 bytes [20.0 TB]
Sector Sizes:     512 bytes logical, 4096 bytes physical
Rotation Rate:    7200 rpm
Form Factor:      3.5 inches
Device is:        In smartctl database 7.3/5528
ATA Version is:   ACS-4 T13/BSR INCITS 529 revision 5
SATA Version is:  SATA 3.3, 6.0 Gb/s (current: 6.0 Gb/s)
Local Time is:    Thu Jul 10 09:45:47 2025 CEST
SMART support is: Available - device has SMART capability.
SMART support is: Enabled
AAM feature is:   Unavailable
APM feature is:   Disabled
Rd look-ahead is: Enabled
Write cache is:   Enabled
DSN feature is:   Disabled
ATA Security is:  Disabled, frozen [SEC2]
Wt Cache Reorder: Enabled

=== START OF READ SMART DATA SECTION ===
SMART overall-health self-assessment test result: PASSED

General SMART Values:
Offline data collection status:  (0x84) Offline data collection activity
                                        was suspended by an interrupting command from host.
                                        Auto Offline Data Collection: Enabled.
Self-test execution status:      ( 247) Self-test routine in progress...
                                        70% of test remaining.
Total time to complete Offline
data collection:                (  120) seconds.
Offline data collection
capabilities:                    (0x5b) SMART execute Offline immediate.
                                        Auto Offline data collection on/off support.
                                        Suspend Offline collection upon new
                                        command.
                                        Offline surface scan supported.
                                        Self-test supported.
                                        No Conveyance Self-test supported.
                                        Selective Self-test supported.
SMART capabilities:            (0x0003) Saves SMART data before entering
                                        power-saving mode.
                                        Supports SMART auto save timer.
Error logging capability:        (0x01) Error logging supported.
                                        General Purpose Logging supported.
Short self-test routine
recommended polling time:        (   2) minutes.
Extended self-test routine
recommended polling time:        (1667) minutes.
SCT capabilities:              (0x003d) SCT Status supported.
                                        SCT Error Recovery Control supported.
                                        SCT Feature Control supported.
                                        SCT Data Table supported.

SMART Attributes Data Structure revision number: 16
Vendor Specific SMART Attributes with Thresholds:
ID# ATTRIBUTE_NAME          FLAGS    VALUE WORST THRESH FAIL RAW_VALUE
  1 Raw_Read_Error_Rate     PO-R--   100   100   050    -    0
  2 Throughput_Performance  P-S---   100   100   050    -    0
  3 Spin_Up_Time            POS--K   100   100   001    -    9502
  4 Start_Stop_Count        -O--CK   100   100   000    -    102
  5 Reallocated_Sector_Ct   PO--CK   100   100   010    -    0
  7 Seek_Error_Rate         PO-R--   100   100   050    -    0
  8 Seek_Time_Performance   P-S---   100   100   050    -    0
  9 Power_On_Hours          -O--CK   068   068   000    -    13138
 10 Spin_Retry_Count        PO--CK   100   100   030    -    0
 12 Power_Cycle_Count       -O--CK   100   100   000    -    102
 23 Helium_Condition_Lower  PO---K   100   100   075    -    0
 24 Helium_Condition_Upper  PO---K   100   100   075    -    0
 27 MAMR_Health_Monitor     PO---K   100   100   030    -    983858
191 G-Sense_Error_Rate      -O--CK   100   100   000    -    3
192 Power-Off_Retract_Count -O--CK   100   100   000    -    50
193 Load_Cycle_Count        -O--CK   100   100   000    -    115
194 Temperature_Celsius     -O---K   100   100   000    -    44 (Min/Max 15/57)
196 Reallocated_Event_Count PO--CK   100   100   010    -    0
197 Current_Pending_Sector  -O--CK   100   100   000    -    2
198 Offline_Uncorrectable   ----CK   100   100   000    -    0
199 UDMA_CRC_Error_Count    -O--CK   200   200   000    -    0
220 Disk_Shift              -O----   100   100   000    -    786432
222 Loaded_Hours            -O--CK   068   068   000    -    13129
226 Load-in_Time            -OS--K   100   100   000    -    683
240 Head_Flying_Hours       P-----   100   100   001    -    0
241 Total_LBAs_Written      -O--CK   100   100   000    -    151715012656
242 Total_LBAs_Read         -O--CK   100   100   000    -    485424497316
                            ||||||_ K auto-keep
                            |||||__ C event count
                            ||||___ R error rate
                            |||____ S speed/performance
                            ||_____ O updated online
                            |______ P prefailure warning

General Purpose Log Directory Version 1
SMART           Log Directory Version 1 [multi-sector log support]
Address    Access  R/W   Size  Description
0x00       GPL,SL  R/O      1  Log Directory
0x01           SL  R/O      1  Summary SMART error log
0x02           SL  R/O     51  Comprehensive SMART error log
0x03       GPL     R/O      5  Ext. Comprehensive SMART error log
0x04       GPL,SL  R/O      8  Device Statistics log
0x06           SL  R/O      1  SMART self-test log
0x07       GPL     R/O      1  Extended self-test log
0x08       GPL     R/O      2  Power Conditions log
0x09           SL  R/W      1  Selective self-test log
0x0a       GPL     R/W      2  Device Statistics Notification
0x0c       GPL     R/O    513  Pending Defects log
0x10       GPL     R/O      1  NCQ Command Error log
0x11       GPL     R/O      1  SATA Phy Event Counters log
0x24       GPL     R/O  65520  Current Device Internal Status Data log
0x25       GPL     R/O  65520  Saved Device Internal Status Data log
0x2f       GPL     R/O      1  Set Sector Configuration
0x30       GPL,SL  R/O      9  IDENTIFY DEVICE data log
0x80-0x9f  GPL,SL  R/W     16  Host vendor specific log
0xab       GPL     VS    1024  Device vendor specific log
0xae       GPL     VS      25  Device vendor specific log
0xe0       GPL,SL  R/W      1  SCT Command/Status
0xe1       GPL,SL  R/W      1  SCT Data Transfer

SMART Extended Comprehensive Error Log Version: 1 (5 sectors)
Device Error Count: 1
        CR     = Command Register
        FEATR  = Features Register
        COUNT  = Count (was: Sector Count) Register
        LBA_48 = Upper bytes of LBA High/Mid/Low Registers ]  ATA-8
        LH     = LBA High (was: Cylinder High) Register    ]   LBA
        LM     = LBA Mid (was: Cylinder Low) Register      ] Register
        LL     = LBA Low (was: Sector Number) Register     ]
        DV     = Device (was: Device/Head) Register
        DC     = Device Control Register
        ER     = Error register
        ST     = Status register
Powered_Up_Time is measured from power on, and printed as
DDd+hh:mm:SS.sss where DD=days, hh=hours, mm=minutes,
SS=sec, and sss=millisec. It "wraps" after 49.710 days.

Error 1 [0] occurred at disk power-on lifetime: 13131 hours (547 days + 3 hours)
  When the command that caused the error occurred, the device was active or idle.

  After command completion occurred, registers were:
  ER -- ST COUNT  LBA_48  LH LM LL DV DC
  -- -- -- == -- == == == -- -- -- -- --
  40 -- 43 00 08 00 01 2d 21 2c 68 40 00  Error: UNC at LBA = 0x12d212c68 = 5052116072

  Commands leading to the command that caused the error were:
  CR FEATR COUNT  LBA_48  LH LM LL DV DC  Powered_Up_Time  Command/Feature_Name
  -- == -- == -- == == == -- -- -- -- --  ---------------  --------------------
  60 00 e0 00 70 00 01 2d 21 40 a8 40 00 37d+11:37:39.442  READ FPDMA QUEUED
  60 05 a0 00 b8 00 01 2d 21 2c f8 40 00 37d+11:37:39.442  READ FPDMA QUEUED
  60 02 48 00 08 00 01 2d 21 2a 28 40 00 37d+11:37:39.442  READ FPDMA QUEUED
  61 00 18 00 58 00 00 63 1d 3a 40 40 00 37d+11:37:39.417  WRITE FPDMA QUEUED
  60 00 28 00 e8 00 01 2d 21 2a 00 40 00 37d+11:37:39.210  READ FPDMA QUEUED

SMART Extended Self-test Log Version: 1 (1 sectors)
Num  Test_Description    Status                  Remaining  LifeTime(hours)  LBA_of_first_error
# 1  Short offline       Completed without error       00%     13128         -
# 2  Short offline       Completed without error       00%     13104         -
# 3  Short offline       Completed without error       00%     13080         -
# 4  Short offline       Completed without error       00%     13056         -
# 5  Short offline       Completed without error       00%     13032         -
# 6  Short offline       Completed without error       00%     13008         -
# 7  Short offline       Completed without error       00%     12984         -
# 8  Short offline       Completed without error       00%     12960         -
# 9  Short offline       Completed without error       00%     12936         -
#10  Short offline       Completed without error       00%     12912         -
#11  Short offline       Completed without error       00%     12888         -
#12  Short offline       Completed without error       00%     12864         -
#13  Short offline       Completed without error       00%     12840         -
#14  Short offline       Completed without error       00%     12816         -
#15  Short offline       Completed without error       00%     12792         -
#16  Short offline       Completed without error       00%     12768         -
#17  Short offline       Completed without error       00%     12744         -
#18  Short offline       Completed without error       00%     12720         -
#19  Short offline       Completed without error       00%     12696         -

SMART Selective self-test log data structure revision number 1
 SPAN  MIN_LBA  MAX_LBA  CURRENT_TEST_STATUS
    1        0        0  Not_testing
    2        0        0  Not_testing
    3        0        0  Not_testing
    4        0        0  Not_testing
    5        0        0  Not_testing
Selective self-test flags (0x0):
  After scanning selected spans, do NOT read-scan remainder of disk.
If Selective self-test is pending on power-up, resume after 0 minute delay.

SCT Status Version:                  3
SCT Version (vendor specific):       1 (0x0001)
Device State:                        DST executing in background (3)
Current Temperature:                    44 Celsius
Power Cycle Min/Max Temperature:     38/57 Celsius
Lifetime    Min/Max Temperature:     15/57 Celsius
Specified Max Operating Temperature:    60 Celsius
Under/Over Temperature Limit Count:   0/0
SMART Status:                        0xc24f (PASSED)
Vendor specific:
00 00 02 00 00 00 00 00 00 00 00 00 00 00 00 00
00 00 00 00 00 00 00 00 00 00 00 00 00 00 00 00

SCT Temperature History Version:     2
Temperature Sampling Period:         1 minute
Temperature Logging Interval:        1 minute
Min/Max recommended Temperature:     10/40 Celsius
Min/Max Temperature Limit:            5/60 Celsius
Temperature History Size (Index):    478 (46)

Index    Estimated Time   Temperature Celsius
  47    2025-07-10 01:48    41  **********************
 ...    ..( 36 skipped).    ..  **********************
  84    2025-07-10 02:25    41  **********************
  85    2025-07-10 02:26    42  ***********************
  86    2025-07-10 02:27    41  **********************
  87    2025-07-10 02:28    41  **********************
  88    2025-07-10 02:29    41  **********************
  89    2025-07-10 02:30    42  ***********************
 ...    ..( 36 skipped).    ..  ***********************
 126    2025-07-10 03:07    42  ***********************
 127    2025-07-10 03:08    43  ************************
 128    2025-07-10 03:09    42  ***********************
 129    2025-07-10 03:10    43  ************************
 ...    ..( 10 skipped).    ..  ************************
 140    2025-07-10 03:21    43  ************************
 141    2025-07-10 03:22    44  *************************
 ...    ..( 12 skipped).    ..  *************************
 154    2025-07-10 03:35    44  *************************
 155    2025-07-10 03:36    45  **************************
 156    2025-07-10 03:37    44  *************************
 157    2025-07-10 03:38    45  **************************
 ...    ..(102 skipped).    ..  **************************
 260    2025-07-10 05:21    45  **************************
 261    2025-07-10 05:22    44  *************************
 262    2025-07-10 05:23    45  **************************
 263    2025-07-10 05:24    45  **************************
 264    2025-07-10 05:25    44  *************************
 ...    ..(174 skipped).    ..  *************************
 439    2025-07-10 08:20    44  *************************
 440    2025-07-10 08:21    43  ************************
 ...    ..(  2 skipped).    ..  ************************
 443    2025-07-10 08:24    43  ************************
 444    2025-07-10 08:25    44  *************************
 445    2025-07-10 08:26    43  ************************
 ...    ..( 49 skipped).    ..  ************************
  17    2025-07-10 09:16    43  ************************
  18    2025-07-10 09:17    44  *************************
  19    2025-07-10 09:18    43  ************************
  20    2025-07-10 09:19    43  ************************
  21    2025-07-10 09:20    44  *************************
 ...    ..( 24 skipped).    ..  *************************
  46    2025-07-10 09:45    44  *************************

SCT Error Recovery Control:
           Read: Disabled
          Write: Disabled

Device Statistics (GP Log 0x04)
Page  Offset Size        Value Flags Description
0x01  =====  =               =  ===  == General Statistics (rev 3) ==
0x01  0x008  4             102  ---  Lifetime Power-On Resets
0x01  0x010  4           13138  ---  Power-on Hours
0x01  0x018  6    151715012656  ---  Logical Sectors Written
0x01  0x020  6      2164560992  ---  Number of Write Commands
0x01  0x028  6    485424497316  ---  Logical Sectors Read
0x01  0x030  6      3061144478  ---  Number of Read Commands
0x01  0x038  6     47296800000  ---  Date and Time TimeStamp
0x01  0x040  4              16  ---  Pending Error Count
0x02  =====  =               =  ===  == Free-Fall Statistics (rev 1) ==
0x02  0x010  4               3  ---  Overlimit Shock Events
0x03  =====  =               =  ===  == Rotating Media Statistics (rev 1) ==
0x03  0x008  4              14  ---  Spindle Motor Power-on Hours
0x03  0x010  4               5  ---  Head Flying Hours
0x03  0x018  4             115  ---  Head Load Events
0x03  0x020  4               0  ---  Number of Reallocated Logical Sectors
0x03  0x028  4            4008  ---  Read Recovery Attempts
0x03  0x030  4               0  ---  Number of Mechanical Start Failures
0x03  0x038  4              16  ---  Number of Realloc. Candidate Logical Sectors
0x03  0x040  4              50  ---  Number of High Priority Unload Events
0x04  =====  =               =  ===  == General Errors Statistics (rev 1) ==
0x04  0x008  4               1  ---  Number of Reported Uncorrectable Errors
0x04  0x010  4               1  ---  Resets Between Cmd Acceptance and Completion
0x04  0x018  4               0  -D-  Physical Element Status Changed
0x05  =====  =               =  ===  == Temperature Statistics (rev 1) ==
0x05  0x008  1              44  ---  Current Temperature
0x05  0x010  1              42  N--  Average Short Term Temperature
0x05  0x018  1              47  N--  Average Long Term Temperature
0x05  0x020  1              57  ---  Highest Temperature
0x05  0x028  1              15  ---  Lowest Temperature
0x05  0x030  1              52  N--  Highest Average Short Term Temperature
0x05  0x038  1              34  N--  Lowest Average Short Term Temperature
0x05  0x040  1              48  N--  Highest Average Long Term Temperature
0x05  0x048  1              39  N--  Lowest Average Long Term Temperature
0x05  0x050  4               0  ---  Time in Over-Temperature
0x05  0x058  1              60  ---  Specified Maximum Operating Temperature
0x05  0x060  4               0  ---  Time in Under-Temperature
0x05  0x068  1               5  ---  Specified Minimum Operating Temperature
0x06  =====  =               =  ===  == Transport Statistics (rev 1) ==
0x06  0x008  4             691  ---  Number of Hardware Resets
0x06  0x010  4             213  ---  Number of ASR Events
0x06  0x018  4               0  ---  Number of Interface CRC Errors
0x07  =====  =               =  ===  == Solid State Device Statistics (rev 1) ==
                                |||_ C monitored condition met
                                ||__ D supports DSN
                                |___ N normalized value

Pending Defects log (GP Log 0x0c)
Index                LBA    Hours
    0         5052096296    13134
    1         5052096297    13134
    2         5052096298    13134
    3         5052096299    13134
    4         5052096300    13134
    5         5052096301    13134
    6         5052096302    13134
    7         5052096303    13134
    8         5052111232    13134
    9         5052111233    13134
   10         5052111234    13134
   11         5052111235    13134
   12         5052111236    13134
   13         5052111237    13134
   14         5052111238    13134
   15         5052111239    13134

SATA Phy Event Counters (GP Log 0x11)
ID      Size     Value  Description
0x0001  4            0  Command failed due to ICRC error
0x0002  4            0  R_ERR response for data FIS
0x0003  4            0  R_ERR response for device-to-host data FIS
0x0004  4            0  R_ERR response for host-to-device data FIS
0x0005  4            0  R_ERR response for non-data FIS
0x0006  4            0  R_ERR response for device-to-host non-data FIS
0x0007  4            0  R_ERR response for host-to-device non-data FIS
0x0008  4            0  Device-to-host non-data FIS retries
0x0009  4            2  Transition from drive PhyRdy to drive PhyNRdy
0x000a  4            2  Device-to-host register FISes sent due to a COMRESET
0x000b  4            0  CRC errors within host-to-device FIS
0x000d  4            0  Non-CRC errors within host-to-device FIS
0x000f  4            0  R_ERR response for host-to-device data FIS, CRC
0x0010  4            0  R_ERR response for host-to-device data FIS, non-CRC
0x0012  4            0  R_ERR response for host-to-device non-data FIS, CRC
0x0013  4            0  R_ERR response for host-to-device non-data FIS, non-CRC
Thanks you ! ![]()
You should also run regular longs tests. Maybe once a month. Edit: And a long test on this drive now!
The drive is growing bad (or at least dubious) sectors. It may not be done yet, but keep an eye on it… and check warranty.
By the way, the drive has reached 57°C, which is close to the specified maximum of 60°C, so you should also have a look at cooling.