System extremely slow after stopping a large copy between datasets

Hi everybody,
I am seeking for your help because I think my copy of a large number of files is taking too long
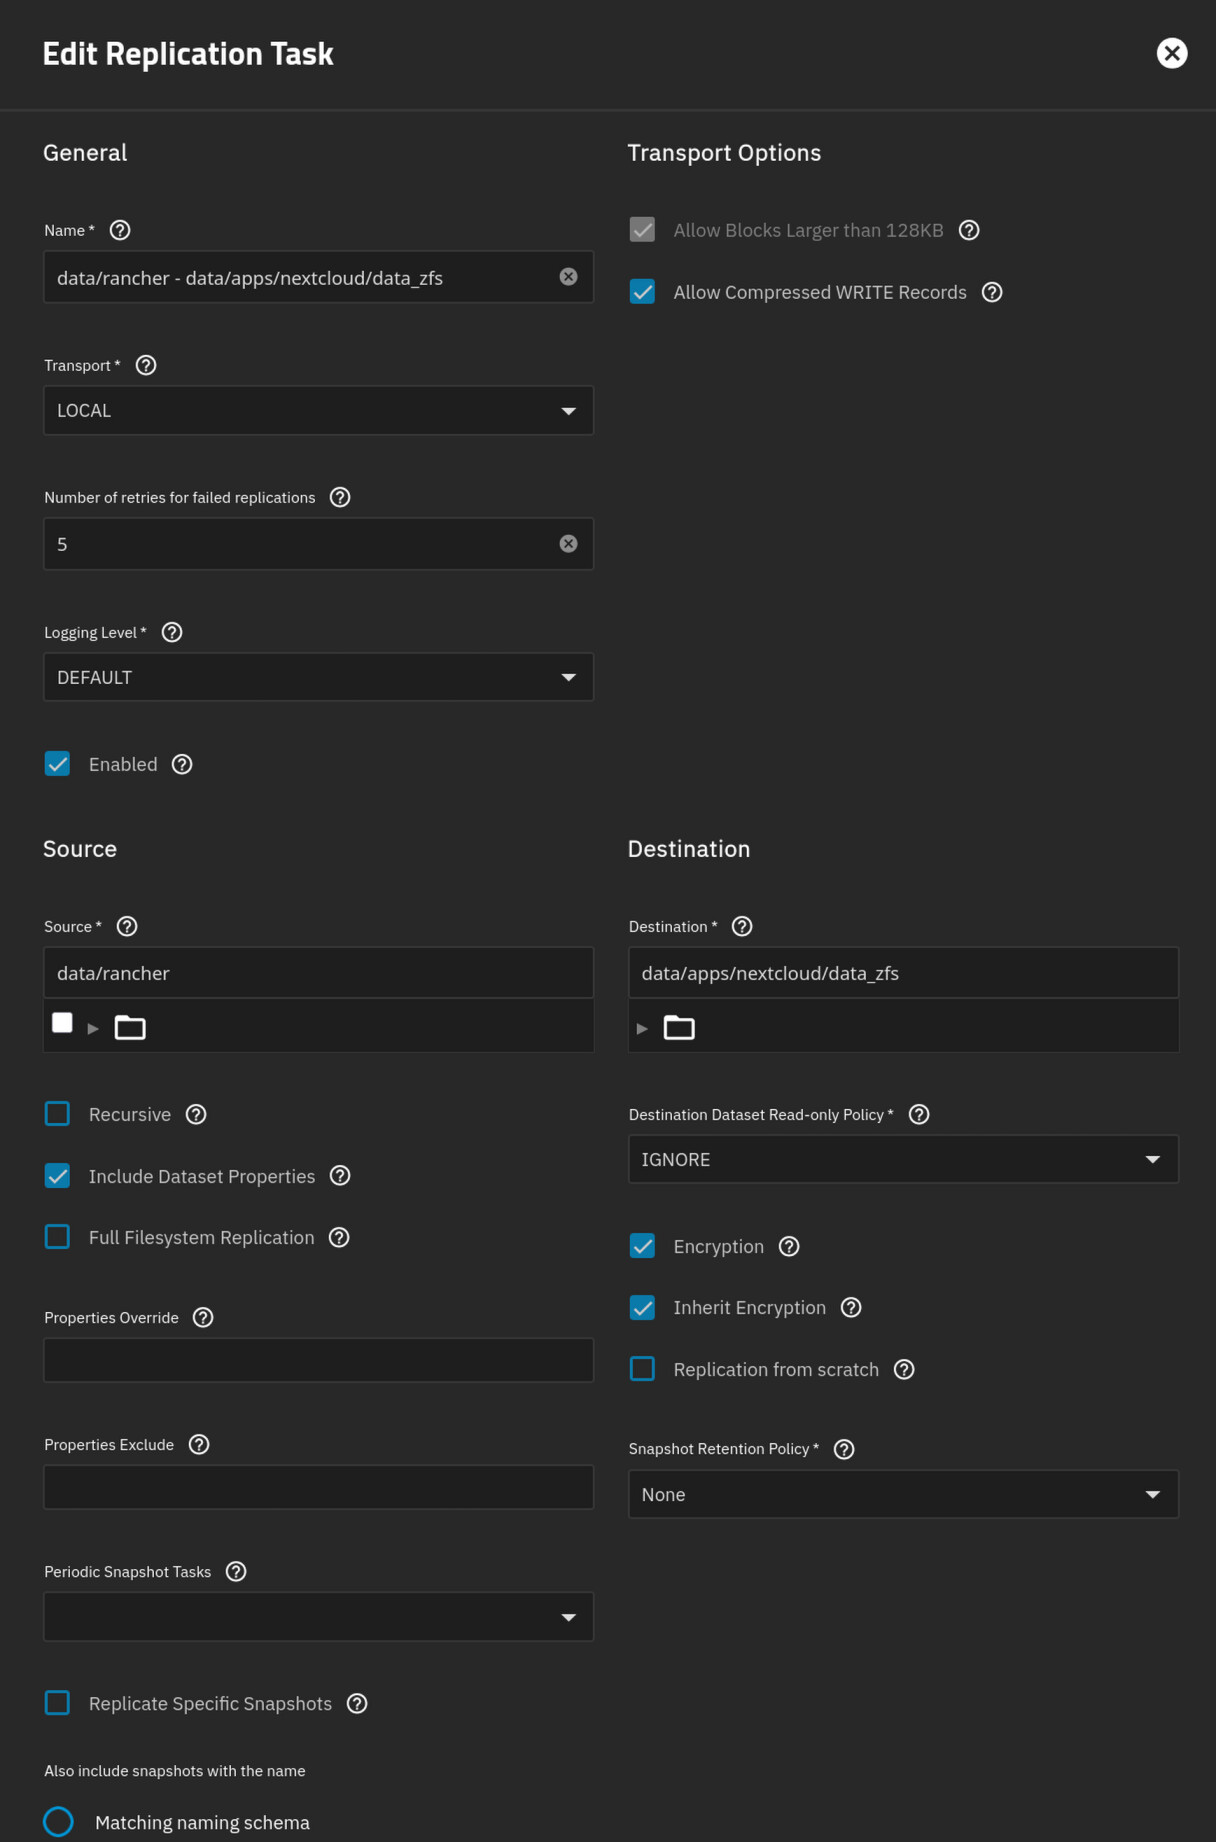
So my goal was to copy my Nextcloud data directory from /mnt/data/rancher/ncfpm/(back from Rancher/ VM/ FreeNAS days) to /mnt/data/apps/nextcloud/data/ using this command:

rsync -rl --no-i-r --info=progress2 --chown=nextcloud:nextcloud  --stats /mnt/data/rancher/ncfpm/ /mnt/data/apps/nextcloud/data/

The old rancherdataset was unencrypted and contained data for multiple service.
I wanted to split datasets between services and add encryption (the new dataset is encrypted).
Furthermore, I added the chown flag to adjust the file permission.

I did a dry run before to see what am I expecting:

Number of files: 2,550,196 (reg: 1,692,349, dir: 857,685, link: 162)
Number of created files: 2,550,031 (reg: 1,692,347, dir: 857,684)
Number of deleted files: 0
Number of regular files transferred: 1,692,349
Total file size: 1,213,261,475,251 bytes
Total transferred file size: 1,213,261,467,599 bytes
Literal data: 0 bytes
Matched data: 0 bytes
File list size: 196,574
File list generation time: 0.001 seconds
File list transfer time: 0.000 seconds
Total bytes sent: 74,513,073
Total bytes received: 8,542,911

sent 74,513,073 bytes  received 8,542,911 bytes  559,299.56 bytes/sec
total size is 1,213,261,475,251  speedup is 14,607.76 (DRY RUN)

Quite a lot of small files (I guess generated image previews) and a total of around 1.2TB of data.
My pool is a RAIDZ with 4 TB SSDs ( VULCAN Z SSD 4TB - TEAMGROUP )
Nothing fancy, but should be doable in a night, I thought…

When I turned on my PC this morning after around 10 hours of transfer, this was the status:

root@truenas:/mnt/data/apps/nextcloud/data# rsync -rl --no-i-r --info=progress2 --chown=nextcloud:nextcloud  --stats /mnt/data/rancher/ncfpm/ /mnt/data/apps/nextcloud/data/

622,807,065,469  51%    9.28MB/s   17:46:40 (xfr#1325000, to-chk=523135/2550196)

So I came to around 622 GB, but the transfer speed has decreased significantly.
It started with around 60 MB/s and then went down to 30 MB/s quite quickly.
But now I can see the individual megabytes increasing just every minute. At this rate I guess this will never finish.

So I stopped all VMs that were still running, disabled any shares and rebooted the system.
Even after rebooting, the TrueNAS UI is very slow compared to what it was before.
Reports don’t load at all or just incomplete (from what I remember) like this ZFS report:

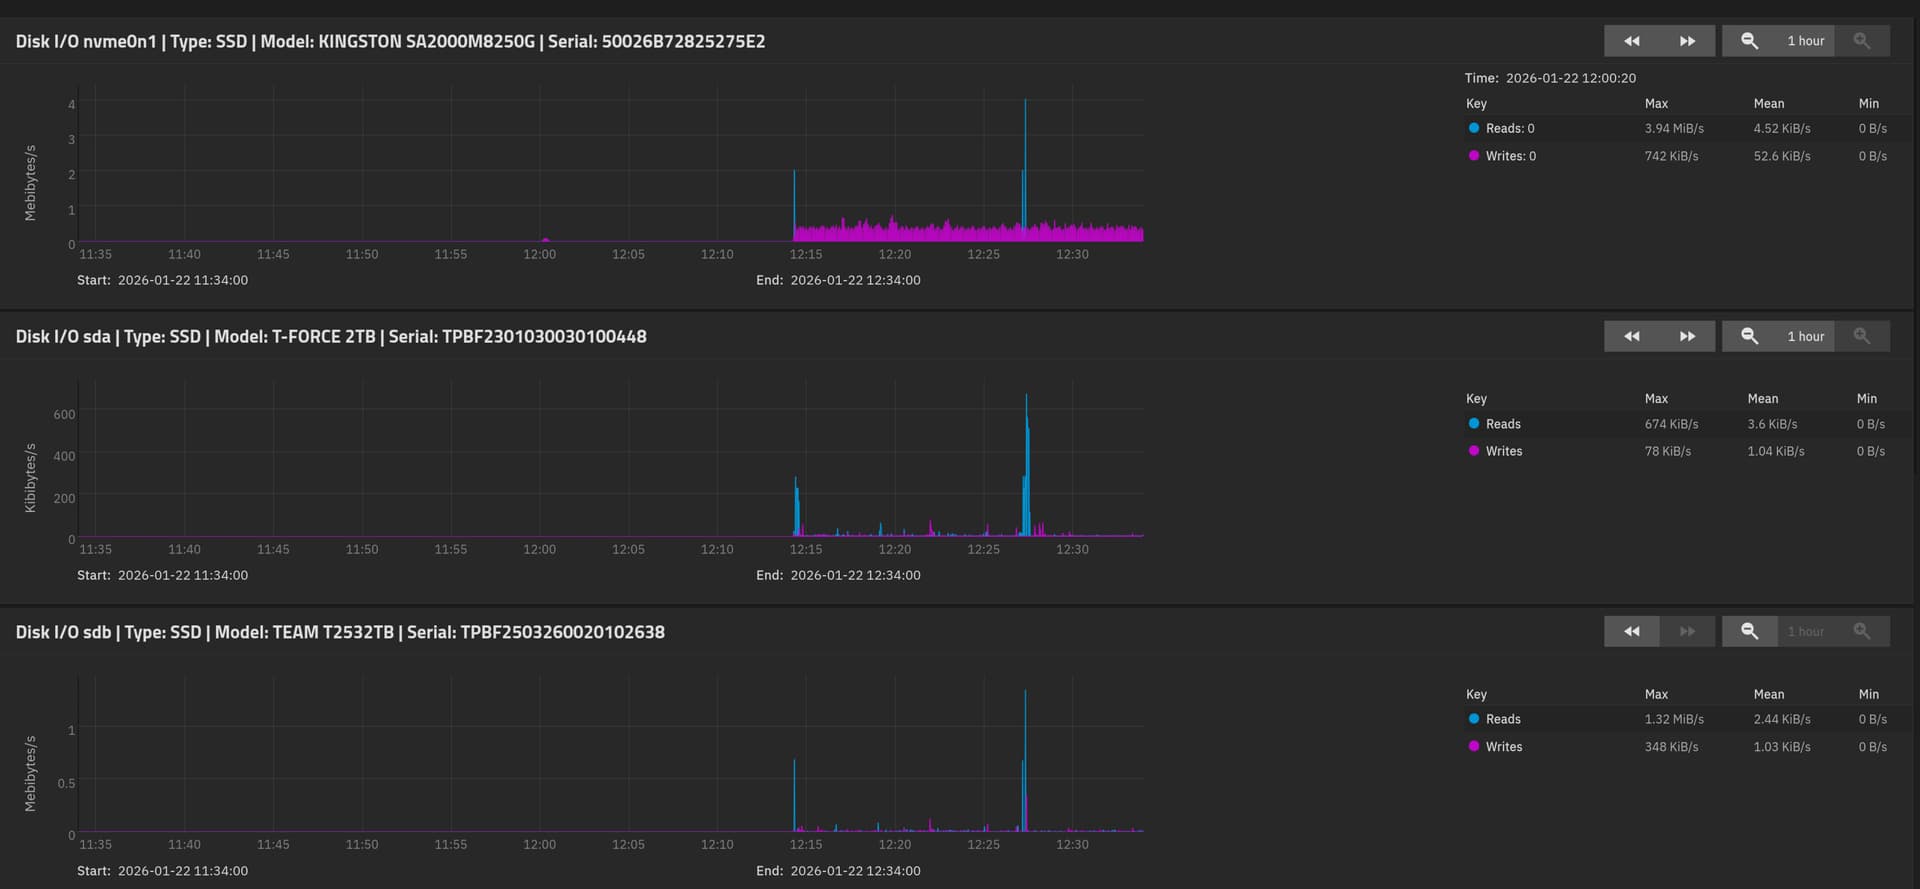
The disk report shows very little load on the disks (first one is from boot pool, the next from the data pool).
I cannot zoom out for more than 1 hour, unfortunately, because it just doesn’t show any data then.

I tried to restart the rsync command, but now it’s not showing any progress at all.
I suppose it is still waiting on the directory traversal completion, something that took a few minutes yesterday, but now I guess the system’s performance is just very slow.

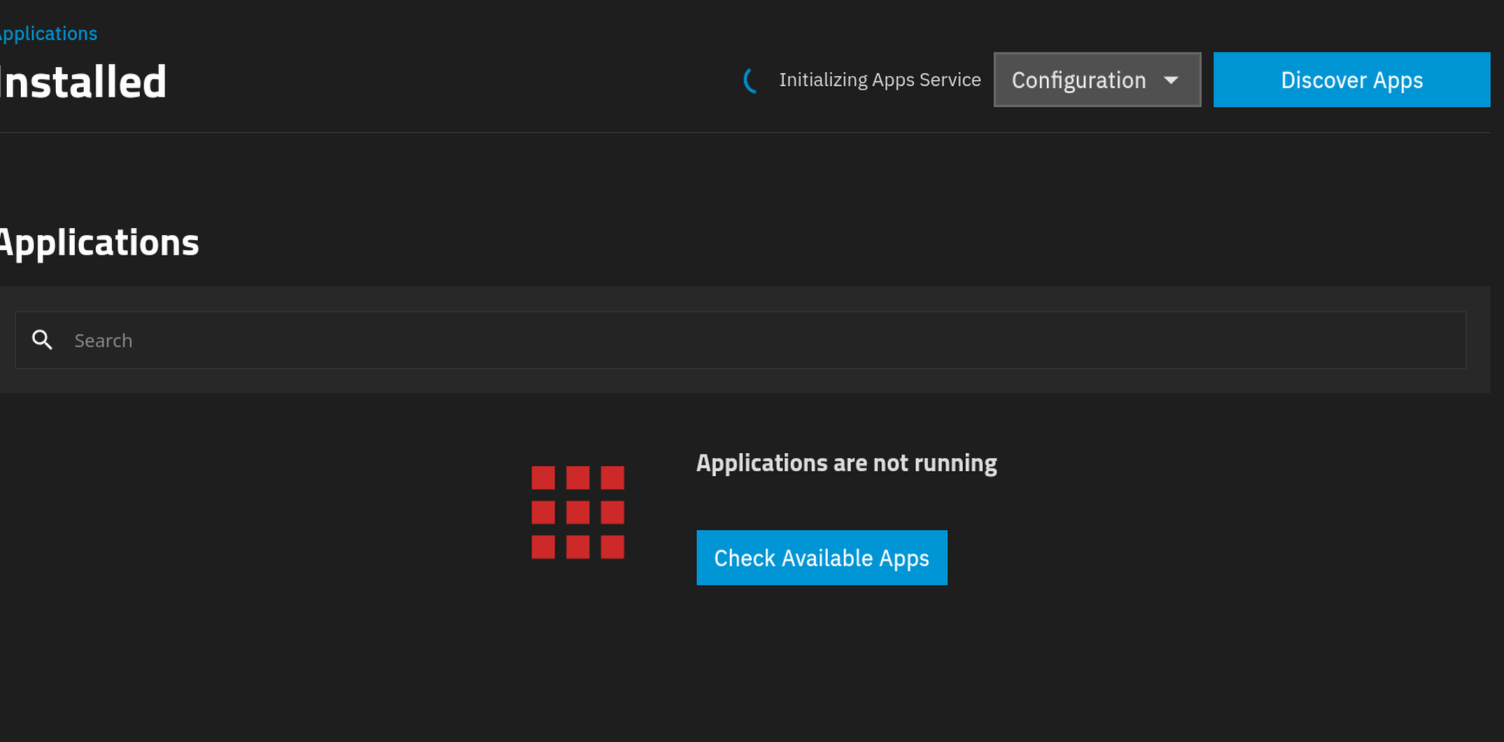
The apps page is stuck on “Initializing apps service” and the Docker daemon doesn’t load anymore.

Any ideas what is going on with my system?

I am using a AMD Ryzen 5 5600 6-Core Processor with 32 GB ECC RAM.
My data pool has still 1.8 TiB free space.
I downloaded debug logs, if those are relevant here…?

Edit: Htop shows no significant load and plenty of memory left:

Copying millions of small files to an encrypted dataset while forcing chown will generate massive amounts of metadata and is likely your cause for slowness. Perhaps try copying the data first then sort the ownership after.

Combine this with SSDs using “SLC” cache. So data has to be written a second time internally to the QLC area.

Thanks @Johnny_Fartpants @Farout for your input.

I can see how the combination of these two factors might be problematic.
Would this also explain why the whole TrueNAS system is so slow, even after a reboot?
Because the SSD is internally still busy copying data to the QLC area? Can I somehow see the status of the SLC cache?

I removed the –chown flag from the rsync command and restarted it again.
Still, the transfer speed is very slow (around 2.28 MB/s).

Only after I started the process yesterday, I discovered that zfs send/ receive could offer better performance for the data transfer.
I could imagine a transfer like this and cleaning unnecessary data afterwards from the dataset:

zfs send -R data/rancher@xyz | zfs receive -F -x encryption data/apps/nextcloud/data

Should I abort the rsync process and switch to that or wouldn’t it make a big difference, because of the SSD bottleneck?

It would reduce the metadata overhead for sure.

1 Like

I would imagine, that it should be finished by now. But I think its impossible to find out. Also the internet says that QLC cache can be from a few GB up to a large portion of the drive…

1 Like

Okay I configured a replication task within TrueNAS, instead of using ZFS send/ receive, so it can run in the background and I can hopefully see some progress:

Does this look correct to you?
Replication is running, but after 5 minutes on 0% (might be okay…?)

And I still wonder how I can get the apps service running again (switching from Docker in a VM to Docker running natively was one of the main reasons I tackled this)?

Edit: Oh the replication task failed:

>[EFAULT] Unable to send dataset ‘data/rancher’ to existing unrelated encrypted dataset ‘data/apps/nextcloud/data_zfs’.

I am running a bit out of ideas.

I found out that when you enter a new dataset name instead of reusing an existing one, it seems like TrueNAS/ ZFS actually lets you transfer the data from an unencrypted to encrypted dataset.
So I gave it a try with a smaller dataset (just ~ 100MB size).
However, after a very long time with no real progress (just a few KB were reported to have transferred) the following error message occurred: Replication “test” failed: cannot open ‘data/apps/nextcloud/new_dataset_name’: dataset does not exist

When I use the piped zfs send/ receive commands ( zfs send -Rv data/small_unencrypted_dataset@test | zfs receive -x encryption data/apps/nextcloud/new_dataset_name), it just doesn’t finish.
The progress went up to 118MB (extremely slowly, it took around 10 minutes) but then nothing happened anymore.

Iostat reported that the drive “sda” was almost 100% utilized:

iostat  -xy
Linux 6.12.33-production+truenas (truenas)      01/22/26        _x86_64_        (12 CPU)

avg-cpu:  %user   %nice %system %iowait  %steal   %idle
           0.10    0.01    0.30   53.18    0.00   46.41

Device            r/s     rkB/s   rrqm/s  %rrqm r_await rareq-sz     w/s     wkB/s   wrqm/s  %wrqm w_await wareq-sz     d/s     dkB/s   drqm/s  %drqm d_await dareq-sz     f/s f_await  aqu-sz  %util
nvme0n1         28.84   1998.10     0.00   0.00    0.23    69.27   15.23    166.44     0.00   0.00    0.19    10.93    0.00      0.00     0.00   0.00    0.00     0.00    0.41    0.34    0.01   0.28
sda              8.15     69.97     0.03   0.37  335.53     8.58    2.27     76.60     0.03   1.14  532.41    33.74    0.00      0.00     0.00   0.00    0.00     0.00    0.02  938.25    3.96  98.17
sdb              8.10     65.88     0.00   0.00    0.18     8.14    3.64     76.63     0.05   1.47    0.15    21.05    0.00      0.00     0.00   0.00    0.00     0.00    0.02    0.25    0.00   0.13
sdc              7.97     64.29     0.00   0.00    0.62     8.07    3.58     76.71     0.05   1.47    0.54    21.40    0.00      0.00     0.00   0.00    0.00     0.00    0.02   13.09    0.01   0.30
sdd              8.31     66.89     0.00   0.00    0.30     8.05    3.40     77.24     0.06   1.62    0.34    22.70    0.00      0.00     0.00   0.00    0.00     0.00    0.02    0.29    0.00   0.21
sde              0.02      0.58     0.00   0.00    8.46    38.69    0.00      0.00     0.00   0.00    0.00     0.00    0.00      0.00     0.00   0.00    0.00     0.00    0.00    0.00    0.00   0.01
sdf              0.18      8.29     0.01   4.30    5.16    47.11    0.00      0.00     0.00   0.00    0.00     0.00    0.00      0.00     0.00   0.00    0.00     0.00    0.00    0.00    0.00   0.06
zd0              0.01      0.43     0.00   0.00    0.00    65.60    0.00      0.00     0.00   0.00    0.00     0.00    0.00      0.00     0.00   0.00    0.00     0.00    0.00    0.00    0.00   0.00

So I decided to do a hard reset, but until now the system didn’t come up again…

Are you using dedupe?

That can be a very good reason for things going slowly

No deduplication is not activated.

So I have access to my system again, after rebooting it manually a few times.
I don’t really know why it didn’t go online after the first time. The kernel logs don’t even show the boot attempts before this morning, so maybe something went wrong before.

I can see in the logs from yesterday that there were a lot of hung tasks like these:

Jan 22 11:43:04 truenas kernel: task:middlewared (wo state:D stack:0     pid:7226  tgid:7226  ppid:1757   flags:0x00000002
Jan 22 11:43:04 truenas kernel: Call Trace:
Jan 22 11:43:04 truenas kernel:  <TASK>
Jan 22 11:43:04 truenas kernel:  __schedule+0x461/0xa10
Jan 22 11:43:04 truenas kernel:  schedule+0x27/0xd0
Jan 22 11:43:04 truenas kernel:  io_schedule+0x46/0x70
Jan 22 11:43:04 truenas kernel:  cv_wait_common+0xa9/0x130 [spl]
Jan 22 11:43:04 truenas kernel:  ? __pfx_autoremove_wake_function+0x10/0x10
Jan 22 11:43:04 truenas kernel:  txg_wait_synced_flags+0xb3/0x100 [zfs]
Jan 22 11:43:04 truenas kernel:  txg_wait_synced+0x10/0x40 [zfs]
Jan 22 11:43:04 truenas kernel:  dsl_sync_task_common+0x216/0x2d0 [zfs]
Jan 22 11:43:04 truenas kernel:  ? __pfx_dsl_props_set_sync+0x10/0x10 [zfs]
Jan 22 11:43:04 truenas kernel:  ? __pfx_dsl_props_set_check+0x10/0x10 [zfs]
Jan 22 11:43:04 truenas kernel:  ? __pfx_dsl_props_set_sync+0x10/0x10 [zfs]
Jan 22 11:43:04 truenas kernel:  dsl_sync_task+0x1a/0x30 [zfs]
Jan 22 11:43:04 truenas kernel:  dsl_props_set+0x5e/0x90 [zfs]
Jan 22 11:43:04 truenas kernel:  zfs_set_prop_nvlist+0x462/0x570 [zfs]
Jan 22 11:43:04 truenas kernel:  zfs_ioc_set_prop+0xb0/0x140 [zfs]
Jan 22 11:43:04 truenas kernel:  ? srso_alias_return_thunk+0x5/0xfbef5
Jan 22 11:43:04 truenas kernel:  zfsdev_ioctl_common+0x5b9/0x6c0 [zfs]
Jan 22 11:43:04 truenas kernel:  zfsdev_ioctl+0x53/0xe0 [zfs]
Jan 22 11:43:04 truenas kernel:  __x64_sys_ioctl+0x94/0xd0
Jan 22 11:43:04 truenas kernel:  do_syscall_64+0x82/0x190
Jan 22 11:43:04 truenas kernel:  ? srso_alias_return_thunk+0x5/0xfbef5
Jan 22 11:43:04 truenas kernel:  ? audit_reset_context+0x232/0x300
Jan 22 11:43:04 truenas kernel:  ? srso_alias_return_thunk+0x5/0xfbef5
Jan 22 11:43:04 truenas kernel:  ? syscall_exit_to_user_mode_prepare+0x148/0x170
Jan 22 11:43:04 truenas kernel:  ? srso_alias_return_thunk+0x5/0xfbef5
Jan 22 11:43:04 truenas kernel:  ? syscall_exit_to_user_mode+0x10/0x1f0
Jan 22 11:43:04 truenas kernel:  ? srso_alias_return_thunk+0x5/0xfbef5
Jan 22 11:43:04 truenas kernel:  ? do_syscall_64+0x8e/0x190
Jan 22 11:43:04 truenas kernel:  ? __irq_exit_rcu+0x38/0xb0
Jan 22 11:43:04 truenas kernel:  entry_SYSCALL_64_after_hwframe+0x76/0x7e
Jan 22 11:43:04 truenas kernel: RIP: 0033:0x7fef0bf6dd1b
Jan 22 11:43:04 truenas kernel: RSP: 002b:00007fff3c339200 EFLAGS: 00000246 ORIG_RAX: 0000000000000010
Jan 22 11:43:04 truenas kernel: RAX: ffffffffffffffda RBX: 00007fff3c3392c0 RCX: 00007fef0bf6dd1b
Jan 22 11:43:04 truenas kernel: RDX: 00007fff3c3392c0 RSI: 0000000000005a16 RDI: 000000000000001b
Jan 22 11:43:04 truenas kernel: RBP: 00007fff3c33ccb0 R08: 0000000024b1cd40 R09: 00007fef0c042d10
Jan 22 11:43:04 truenas kernel: R10: 0000000000000000 R11: 0000000000000246 R12: 00000000256c8900
Jan 22 11:43:04 truenas kernel: R13: 0000000025915dc0 R14: 00000000259150a0 R15: 000000000000000a

Or

Jan 22 11:45:05 truenas kernel: task:kworker/6:1     state:D stack:0     pid:117   tgid:117   ppid:2      flags:0x00004000
Jan 22 11:45:05 truenas kernel: Workqueue: events_freezable_pwr_efficient disk_events_workfn
Jan 22 11:45:05 truenas kernel: Call Trace:
Jan 22 11:45:05 truenas kernel:  <TASK>
Jan 22 11:45:05 truenas kernel:  __schedule+0x461/0xa10
Jan 22 11:45:05 truenas kernel:  schedule+0x27/0xd0
Jan 22 11:45:05 truenas kernel:  schedule_preempt_disabled+0x15/0x30
Jan 22 11:45:05 truenas kernel:  __mutex_lock.constprop.0+0x34c/0x6a0
Jan 22 11:45:05 truenas kernel:  zvol_check_events+0x38/0xc0 [zfs]
Jan 22 11:45:05 truenas kernel:  disk_check_events+0x3a/0x100
Jan 22 11:45:05 truenas kernel:  process_one_work+0x183/0x3a0
Jan 22 11:45:05 truenas kernel:  worker_thread+0x2da/0x420
Jan 22 11:45:05 truenas kernel:  ? __pfx_worker_thread+0x10/0x10
Jan 22 11:45:05 truenas kernel:  kthread+0xd2/0x100
Jan 22 11:45:05 truenas kernel:  ? __pfx_kthread+0x10/0x10
Jan 22 11:45:05 truenas kernel:  ret_from_fork+0x34/0x50
Jan 22 11:45:05 truenas kernel:  ? __pfx_kthread+0x10/0x10
Jan 22 11:45:05 truenas kernel:  ret_from_fork_asm+0x1a/0x30
Jan 22 11:45:05 truenas kernel:  </TASK>
Jan 22 11:45:05 truenas kernel: Future hung task reports are suppressed, see sysctl kernel.hung_task_warnings

I guess that was because my sda disk was overloaded, as the iostats showed.

But I am more concerned of these messages that got logged after I performed a soft reboot but a few minutes before the hard reboot:

Jan 22 15:33:38 truenas systemd[1]: user@0.service: Unit process 20812 (zfs) remains running after unit stopped.
Jan 22 15:33:38 truenas systemd[1]: user@0.service: Unit process 20811 (zfs) remains running after unit stopped.
Jan 22 15:33:38 truenas systemd[1]: user@0.service: Failed with result 'timeout'.
Jan 22 15:33:38 truenas systemd[1]: user@0.service: Processes still around after final SIGKILL. Entering failed mode.
Jan 22 15:31:38 truenas systemd[1]: user@0.service: Killing process 20812 (zfs) with signal SIGKILL.
Jan 22 15:31:38 truenas systemd[1]: user@0.service: Killing process 20811 (zfs) with signal SIGKILL.
Jan 22 15:31:38 truenas systemd[1]: user@0.service: Main process exited, code=killed, status=9/KILL
Jan 22 15:31:37 truenas systemd[1]: user@0.service: Killing process 20812 (zfs) with signal SIGKILL.
Jan 22 15:31:37 truenas systemd[1]: user@0.service: Killing process 20811 (zfs) with signal SIGKILL.
Jan 22 15:31:37 truenas systemd[1]: user@0.service: Killing process 6538 (systemd) with signal SIGKILL.
Jan 22 15:31:37 truenas systemd[1]: user@0.service: State 'stop-sigterm' timed out. Killing.
Jan 22 15:31:07 truenas systemd[6538]: tmux-spawn-7bd7f609-a7ba-419d-ba3c-c3222f0fd19d.scope: Killing process 20812 (zfs) with signal SIGKILL.
Jan 22 15:31:07 truenas systemd[6538]: tmux-spawn-7bd7f609-a7ba-419d-ba3c-c3222f0fd19d.scope: Killing process 20811 (zfs) with signal SIGKILL.
Jan 22 15:31:07 truenas systemd[6538]: tmux-spawn-7bd7f609-a7ba-419d-ba3c-c3222f0fd19d.scope: Stopping timed out. Killing.
Jan 22 15:29:41 truenas systemd[1]: Stopped networking.service - Raise network interfaces.
Jan 22 15:29:41 truenas systemd[1]: networking.service: Deactivated successfully.

To me it seems like these are the zfs send/ receive commands that were still stuck in the tmux terminals that cannot be aborted somehow, even with a SIGKILL signal.
I could imagine that it is related to this ZFS issue: zfs send can become unkillable if not `HAVE_LARGE_STACKS` ¡ Issue #12500 ¡ openzfs/zfs ¡ GitHub
Now I am a bit scared of using these commands again, if it can mean that the system will get stuck in an “unrebootable” state (or at least not soft-rebootable).

I’ve restarted the rsync process, without setting the owner, and it is still very slow (around 1-6 MB/s).
Before that i did a dry run which showed that “just” ~500k files were missing with a total of ~521GB, so roughly 1 MB per file.
I guess these are not “tiny files” and not a huge number to transfer.

Dry Run

rsync -rlt --size-only --info=progress2 --stats --dry-run /mnt/data/rancher/ncfpm/ /mnt/data/apps/nextcloud/data/
590,454,402,130 48% 549903.51GB/s 0:00:00 (xfr#367349, to-chk=0/2550196)

Number of files: 2,550,196 (reg: 1,692,349, dir: 857,685, link: 162)
Number of created files: 521,279 (reg: 367,349, dir: 153,827, link: 103)
Number of deleted files: 0
Number of regular files transferred: 367,349
Total file size: 1,213,261,475,251 bytes
Total transferred file size: 590,454,402,130 bytes
Literal data: 0 bytes
Matched data: 0 bytes
File list size: 196,574
File list generation time: 0.001 seconds
File list transfer time: 0.000 seconds
Total bytes sent: 74,521,444
Total bytes received: 8,528,172

I’ve also increase the metadata eviction priority using echo 2000 > /sys/module/zfs/parameters/zfs_arc_meta_balance
The ARC statistics show that 2 GB are used for metadata, not sure how to interpret that number.

arc_summary

arc_summary


ZFS Subsystem Report Fri Jan 23 14:57:15 2026
Linux 6.12.33-production+truenas 2.3.4-1
Machine: truenas (x86_64) 2.3.4-1

ARC status:
Total memory size: 31.3 GiB
Min target size: 3.1 % 1000.4 MiB
Max target size: 96.8 % 30.3 GiB
Target size (adaptive): 64.4 % 19.5 GiB
Current size: 64.4 % 19.5 GiB
Free memory size: 1.7 GiB
Available memory size: 559.2 MiB

ARC structural breakdown (current size): 19.5 GiB
Compressed size: 53.9 % 10.5 GiB
Overhead size: 26.2 % 5.1 GiB
Bonus size: 3.6 % 712.5 MiB
Dnode size: 10.6 % 2.1 GiB
Dbuf size: 4.3 % 861.9 MiB
Header size: 1.4 % 281.5 MiB
L2 header size: 0.0 % 0 Bytes
ABD chunk waste size: < 0.1 % 2.5 MiB

ARC types breakdown (compressed + overhead): 15.6 GiB
Data size: 87.1 % 13.6 GiB
Metadata size: 12.9 % 2.0 GiB

ARC states breakdown (compressed + overhead): 15.6 GiB
Anonymous data size: 20.3 % 3.2 GiB
Anonymous metadata size: < 0.1 % 5.5 MiB
MFU data target: 35.0 % 5.5 GiB
MFU data size: 2.5 % 403.3 MiB
MFU evictable data size: 2.5 % 393.2 MiB
MFU ghost data size: 0 Bytes
MFU metadata target: 15.1 % 2.4 GiB
MFU metadata size: 3.7 % 584.9 MiB
MFU evictable metadata size: 0.6 % 89.4 MiB
MFU ghost metadata size: 2.0 GiB
MRU data target: 35.0 % 5.5 GiB
MRU data size: 64.3 % 10.0 GiB
MRU evictable data size: 57.4 % 9.0 GiB
MRU ghost data size: 1.2 GiB
MRU metadata target: 14.9 % 2.3 GiB
MRU metadata size: 9.2 % 1.4 GiB
MRU evictable metadata size: 0.3 % 50.2 MiB
MRU ghost metadata size: 3.1 GiB
Uncached data size: < 0.1 % 428.0 KiB
Uncached metadata size: 0.0 % 0 Bytes

Maybe metadata isn’t the issue in this case?
I checked the RAM usage stats and there is still 6.2 GB free memory after the rsync command transferred 87GB.

IIUC ZFS shows that write operations have to wait for 25 seconds on my data pool :face_with_raised_eyebrow:

zpool iostat -yl 9 1                                                                                                                                                truenas: Fri Jan 23 15:05:32 2026

              capacity     operations     bandwidth    total_wait     disk_wait    syncq_wait    asyncq_wait  scrub   trim  rebuild
pool        alloc   free   read  write   read  write   read  write   read  write   read  write   read  write   wait   wait   wait
----------  -----  -----  -----  -----  -----  -----  -----  -----  -----  -----  -----  -----  -----  -----  -----  -----  -----
boot-pool   21.4G   195G      0     17      0   292K      -  869us      -  289us      -  832ns      -  641us      -      -      -
data        4.90T  2.53T     22      5  1.13M   387K  707ms    25s  124ms     2s      -      -  600ms    22s      -      -      -
----------  -----  -----  -----  -----  -----  -----  -----  -----  -----  -----  -----  -----  -----  -----  -----  -----  -----

That seems way too much for me.

Iostat shows that there is again one drive sdb that is taking very long to handle the requests:

iostat -sxy 10
Linux 6.12.33-production+truenas (truenas)      01/23/26        _x86_64_        (12 CPU)


avg-cpu:  %user   %nice %system %iowait  %steal   %idle
           0.19    0.00    1.38   20.20    0.00   78.23

Device             tps      kB/s    rqm/s   await  areq-sz  aqu-sz  %util
nvme0n1          17.60    199.60     0.00    0.19    11.34    0.00   0.16
sda             142.40   7732.00     2.30    0.41    54.30    0.06   2.44
sdb              93.70   6710.00     2.70   37.09    71.61    3.49  95.24
sdc             167.70   9678.80     1.90    0.78    57.71    0.13   4.12
sdd             152.40   9476.40     1.80    0.56    62.18    0.08   3.20
sde               0.00      0.00     0.00    0.00     0.00    0.00   0.00
sdf               0.00      0.00     0.00    0.00     0.00    0.00   0.00
zd0               0.00      0.00     0.00    0.00     0.00    0.00   0.00
 

(I did the check repeatedly for many minutes, and it was always this drive showing the highest %util values).
It is the same drive that was labeled as sda yesterday before the reboot (I confirmed that by comparing the serial numbers), just after the reboot it is labeled as sdb.
Here is the SMART output:

smartctl -ax /dev/sdb
smartctl 7.4 2023-08-01 r5530 [x86_64-linux-6.12.33-production+truenas] (local build)
Copyright (C) 2002-23, Bruce Allen, Christian Franke, www.smartmontools.org

=== START OF INFORMATION SECTION ===
Device Model:     T-FORCE 2TB
Serial Number:    TPBF2301030030100448
Firmware Version: V1128A0
User Capacity:    2,048,408,248,320 bytes [2.04 TB]
Sector Size:      512 bytes logical/physical
Rotation Rate:    Solid State Device
Form Factor:      2.5 inches
TRIM Command:     Available
Device is:        Not in smartctl database 7.3/5528
ATA Version is:   ACS-2 T13/2015-D revision 3
SATA Version is:  SATA 3.2, 6.0 Gb/s (current: 6.0 Gb/s)
Local Time is:    Fri Jan 23 14:40:07 2026 CET
SMART support is: Available - device has SMART capability.
SMART support is: Enabled
AAM feature is:   Unavailable
APM feature is:   Disabled
Rd look-ahead is: Enabled
Write cache is:   Enabled
DSN feature is:   Unavailable
ATA Security is:  Disabled, frozen [SEC2]
Wt Cache Reorder: Unavailable

=== START OF READ SMART DATA SECTION ===
SMART overall-health self-assessment test result: PASSED

General SMART Values:
Offline data collection status:  (0x00) Offline data collection activity
                                        was never started.
                                        Auto Offline Data Collection: Disabled.
Self-test execution status:      (   0) The previous self-test routine completed
                                        without error or no self-test has ever 
                                        been run.
Total time to complete Offline 
data collection:                (  120) seconds.
Offline data collection
capabilities:                    (0x11) SMART execute Offline immediate.
                                        No Auto Offline data collection support.
                                        Suspend Offline collection upon new
                                        command.
                                        No Offline surface scan supported.
                                        Self-test supported.
                                        No Conveyance Self-test supported.
                                        No Selective Self-test supported.
SMART capabilities:            (0x0002) Does not save SMART data before
                                        entering power-saving mode.
                                        Supports SMART auto save timer.
Error logging capability:        (0x01) Error logging supported.
                                        General Purpose Logging supported.
Short self-test routine 
recommended polling time:        (   2) minutes.
Extended self-test routine
recommended polling time:        (  10) minutes.
SCT capabilities:              (0x0001) SCT Status supported.

SMART Attributes Data Structure revision number: 1
Vendor Specific SMART Attributes with Thresholds:
ID# ATTRIBUTE_NAME          FLAGS    VALUE WORST THRESH FAIL RAW_VALUE
  1 Raw_Read_Error_Rate     -O--CK   100   100   050    -    0
  5 Reallocated_Sector_Ct   -O--CK   100   100   050    -    0
  9 Power_On_Hours          -O--CK   100   100   050    -    23167
 12 Power_Cycle_Count       -O--CK   100   100   050    -    62
160 Unknown_Attribute       -O--CK   100   100   050    -    0
161 Unknown_Attribute       PO--CK   100   100   050    -    100
163 Unknown_Attribute       -O--CK   100   100   050    -    13
164 Unknown_Attribute       -O--CK   100   100   050    -    150589
165 Unknown_Attribute       -O--CK   100   100   050    -    506
166 Unknown_Attribute       -O--CK   100   100   050    -    2
167 Unknown_Attribute       -O--CK   100   100   050    -    49
168 Unknown_Attribute       -O--CK   100   100   050    -    5050
169 Unknown_Attribute       -O--CK   100   100   050    -    100
175 Program_Fail_Count_Chip -O--CK   100   100   050    -    0
176 Erase_Fail_Count_Chip   -O--CK   100   100   050    -    0
177 Wear_Leveling_Count     -O--CK   100   100   050    -    0
178 Used_Rsvd_Blk_Cnt_Chip  -O--CK   100   100   050    -    0
181 Program_Fail_Cnt_Total  -O--CK   100   100   050    -    0
182 Erase_Fail_Count_Total  -O--CK   100   100   050    -    0
192 Power-Off_Retract_Count -O--CK   100   100   050    -    40
194 Temperature_Celsius     -O---K   100   100   050    -    33
195 Hardware_ECC_Recovered  -O--CK   100   100   050    -    0
196 Reallocated_Event_Count -O--CK   100   100   050    -    0
197 Current_Pending_Sector  -O--CK   100   100   050    -    0
198 Offline_Uncorrectable   -O--CK   100   100   050    -    0
199 UDMA_CRC_Error_Count    -O--CK   100   100   050    -    0
232 Available_Reservd_Space -O--CK   100   100   050    -    100
241 Total_LBAs_Written      ----CK   100   100   050    -    564312
242 Total_LBAs_Read         ----CK   100   100   050    -    2461580
245 Unknown_Attribute       -O--CK   100   100   050    -    2389586
                            ||||||_ K auto-keep
                            |||||__ C event count
                            ||||___ R error rate
                            |||____ S speed/performance
                            ||_____ O updated online
                            |______ P prefailure warning

General Purpose Log Directory Version 1
SMART           Log Directory Version 1 [multi-sector log support]
Address    Access  R/W   Size  Description
0x00       GPL,SL  R/O      1  Log Directory
0x01           SL  R/O      1  Summary SMART error log
0x02           SL  R/O      1  Comprehensive SMART error log
0x03       GPL     R/O      1  Ext. Comprehensive SMART error log
0x04       GPL,SL  R/O      8  Device Statistics log
0x06           SL  R/O      1  SMART self-test log
0x07       GPL     R/O      1  Extended self-test log
0x10       GPL     R/O      1  NCQ Command Error log
0x11       GPL     R/O      1  SATA Phy Event Counters log
0x24       GPL     R/O     88  Current Device Internal Status Data log
0x25       GPL     R/O     32  Saved Device Internal Status Data log
0x30       GPL,SL  R/O      9  IDENTIFY DEVICE data log
0x80-0x9f  GPL,SL  R/W     16  Host vendor specific log

SMART Extended Comprehensive Error Log Version: 1 (1 sectors)
No Errors Logged

SMART Error Log Version: 1
No Errors Logged

SMART Extended Self-test Log Version: 1 (1 sectors)
Num  Test_Description    Status                  Remaining  LifeTime(hours)  LBA_of_first_error
# 1  Short offline       Interrupted (host reset)      90%     23132         -
# 2  Extended offline    Completed without error       00%     23108         -
# 3  Short offline       Completed without error       00%     23084         -
# 4  Short offline       Completed without error       00%     23060         -
# 5  Short offline       Completed without error       00%     23038         -
# 6  Short offline       Interrupted (host reset)      90%     23036         -
# 7  Short offline       Completed without error       00%     23012         -
# 8  Short offline       Completed without error       00%     22988         -
# 9  Short offline       Completed without error       00%     22964         -
#10  Extended offline    Completed without error       00%     22940         -
#11  Short offline       Completed without error       00%     22915         -
#12  Short offline       Completed without error       00%     22891         -
#13  Short offline       Completed without error       00%     22867         -
#14  Short offline       Completed without error       00%     22843         -
#15  Short offline       Completed without error       00%     22819         -
#16  Short offline       Completed without error       00%     22795         -
#17  Extended offline    Completed without error       00%     22772         -
#18  Short offline       Completed without error       00%     22747         -
#19  Short offline       Completed without error       00%     22723         -

SMART Self-test log structure revision number 1
Num  Test_Description    Status                  Remaining  LifeTime(hours)  LBA_of_first_error
# 1  Short offline       Interrupted (host reset)      90%     23132         -
# 2  Extended offline    Completed without error       00%     23108         -
# 3  Short offline       Completed without error       00%     23084         -
# 4  Short offline       Completed without error       00%     23060         -
# 5  Short offline       Completed without error       00%     23038         -
# 6  Short offline       Interrupted (host reset)      90%     23036         -
# 7  Short offline       Completed without error       00%     23012         -
# 8  Short offline       Completed without error       00%     22988         -
# 9  Short offline       Completed without error       00%     22964         -
#10  Extended offline    Completed without error       00%     22940         -
#11  Short offline       Completed without error       00%     22915         -
#12  Short offline       Completed without error       00%     22891         -
#13  Short offline       Completed without error       00%     22867         -
#14  Short offline       Completed without error       00%     22843         -
#15  Short offline       Completed without error       00%     22819         -
#16  Short offline       Completed without error       00%     22795         -
#17  Extended offline    Completed without error       00%     22772         -
#18  Short offline       Completed without error       00%     22747         -
#19  Short offline       Completed without error       00%     22723         -
#20  Short offline       Completed without error       00%     22699         -
#21  Short offline       Completed without error       00%     22675         -

Selective Self-tests/Logging not supported

SCT Status Version:                  3
SCT Version (vendor specific):       0 (0x0000)
Device State:                        Active (0)
Current Temperature:                    33 Celsius
Power Cycle Min/Max Temperature:     33/33 Celsius
Lifetime    Min/Max Temperature:      9/39 Celsius
Specified Max Operating Temperature:   100 Celsius
Under/Over Temperature Limit Count:   0/0

SCT Data Table command not supported

SCT Error Recovery Control command not supported

Device Statistics (GP Log 0x04)
Page  Offset Size        Value Flags Description
0x01  =====  =               =  ===  == General Statistics (rev 1) ==
0x01  0x008  4              62  ---  Lifetime Power-On Resets
0x01  0x010  4           23167  ---  Power-on Hours
0x01  0x018  6      2623053885  ---  Logical Sectors Written
0x01  0x020  6      1417999929  ---  Number of Write Commands
0x01  0x028  6      2408373473  ---  Logical Sectors Read
0x01  0x030  6       656792389  ---  Number of Read Commands
0x07  =====  =               =  ===  == Solid State Device Statistics (rev 1) ==
0x07  0x008  1               1  ---  Percentage Used Endurance Indicator
                                |||_ C monitored condition met
                                ||__ D supports DSN
                                |___ N normalized value

Pending Defects log (GP Log 0x0c) not supported

SATA Phy Event Counters (GP Log 0x11)
ID      Size     Value  Description
0x0001  4            0  Command failed due to ICRC error
0x0002  4            0  R_ERR response for data FIS
0x0005  4            0  R_ERR response for non-data FIS
0x000a  4            2  Device-to-host register FISes sent due to a COMRESET

Do you think that I should replace this drive? Any other ideas what is going on?

Edit: It seems like there is really something wrong with the drive.
The SMART tests that I tried starting are getting aborted every time:

SMART Self-test log structure revision number 1
Num  Test_Description    Status                  Remaining  LifeTime(hours)  LBA_of_first_error
# 1  Extended offline    Interrupted (host reset)      90%     23168         -
# 2  Short offline       Interrupted (host reset)      90%     23167         -
# 3  Short offline       Interrupted (host reset)      90%     23132         -
# 4  Extended offline    Completed without error       00%     23108         -


DMSEG shows some errors and hard resets as well... 
[28409.234465] ata2.00: failed command: WRITE FPDMA QUEUED
[28409.235077] ata2.00: cmd 61/b0:c0:c0:86:06/00:00:3e:00:00/40 tag 24 ncq dma 90112 out
                        res 40/00:01:00:00:00/00:00:00:00:00/00 Emask 0x4 (timeout)
[28409.236074] ata2.00: status: { DRDY }
[28409.236686] ata2.00: failed command: WRITE FPDMA QUEUED
[28409.237186] ata2.00: cmd 61/b0:c8:10:86:06/00:00:3e:00:00/40 tag 25 ncq dma 90112 out
                        res 40/00:01:e0:4f:c2/00:00:00:00:00/00 Emask 0x4 (timeout)
[28409.238329] ata2.00: status: { DRDY }
[28409.238840] ata2: hard resetting link
[28409.708043] ata2: SATA link up 6.0 Gbps (SStatus 133 SControl 300)
[28409.714160] ata2.00: configured for UDMA/133
[28409.714189] ata2: EH complete
[29456.029834] ata2.00: exception Emask 0x0 SAct 0x30000 SErr 0x0 action 0x6 frozen
[29456.030913] ata2.00: failed command: WRITE FPDMA QUEUED
[29456.031465] ata2.00: cmd 61/20:80:c8:a3:0b/04:00:3e:00:00/40 tag 16 ncq dma 540672 out
                        res 40/00:01:e0:4f:c2/00:00:00:00:00/00 Emask 0x4 (timeout)
[29456.032575] ata2.00: status: { DRDY }
[29456.033054] ata2.00: failed command: WRITE FPDMA QUEUED
[29456.033690] ata2.00: cmd 61/60:88:00:a8:0b/01:00:3e:00:00/40 tag 17 ncq dma 180224 out
                        res 40/00:01:00:4f:c2/00:00:00:00:00/00 Emask 0x4 (timeout)
[29456.034661] ata2.00: status: { DRDY }
[29456.035266] ata2: hard resetting link
[29459.645585] ata2: SATA link up 6.0 Gbps (SStatus 133 SControl 300)
[29459.651823] ata2.00: configured for UDMA/133
[29459.651838] ata2: EH complete

Well, to sum this up, the disk in question seemed to be problematic.
I tried to continue the rsync operation after i re-plugged all the SATA cables but at some point I got the following error:

Pool data state is ONLINE: One or more devices are faulted in response to persistent errors. Sufficient replicas exist for the pool to continue functioning in a degraded state.
The following devices are not healthy:

  • Disk T-FORCE_2TB TPBF2301030030100448 is FAULTED

I then replaced all the SATA cables with new ones from Asrock that have a locking clip (?), so they cannot detach themselves easily anymore.
In the same run, I also plugged the disk to a separated PC and did a long SMART run there, which didn’t show any problems.

Nevertheless, I decided to completely replace the SSD with a new one from the same family, because the iostat/ zpool iostat showed very high waiting times/ utilization for that particular disk in comparison to all the others.

With the new disk, the operation eventually was successfully.
Still, after the replacement I have seen very high waiting/ utilization stats for a different (old) disk, so I will create a separate threat to ask about the significance of these numbers.
But for now, it works. Thanks for your ideas guys.