rosk
February 16, 2026, 8:14am
1
I sat up a NAS for a friend of mine with 2 x Toshiba in mirror.
Yesterday I logged into it to just have a look. Everything looked fine, until I opened Scrutiny.
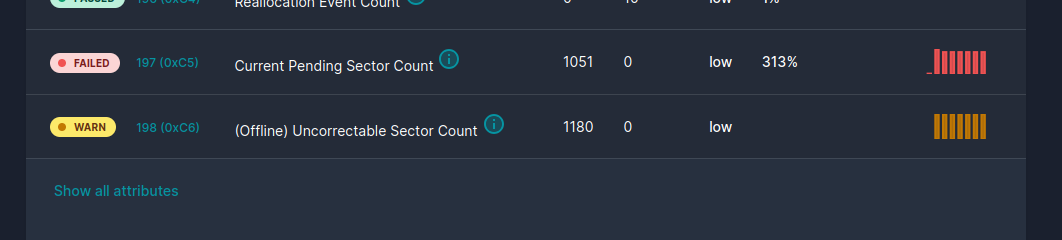
One of his HDD’s came up as failed in Scrutiny.
As standard his NAS was scheduled to do a scrub at 00:00 Sunday.
But still no errors on the NAS itself.
His disk about to fail? Disk is less than 1 month old.
And why no errors on TrueNAS itself?
LarsR
February 16, 2026, 8:19am
2
Scrutiny can use 2 different metrics, its own and smart metrics. See if it also fails if you only use smart metrics for disk health and not both or only scrutiny.
rosk
February 16, 2026, 8:23am
3
If I change to SMART it changes to PASS, if I do both or Scrutiny it goes back to FAILED.
LarsR
February 16, 2026, 8:28am
4
I’m not 100% certain, but i believe scrutiny uses different error limits and flags the disks as failed…
rosk
February 16, 2026, 8:37am
5
Thanks. Looks like you are right. Scrutiny seems to be more strict with values.
From what I was able to find out it seems that TrueNAS passes the disk if it’s able to write data to different parts on the disk. While Scrutiny looks at raw data and reports error if they start getting above a set value.
LarsR
February 16, 2026, 8:40am
6
I also have one 11 year old hdd that passes smart but fails in scrutiny. been that way for over a year. Since truenas doesn’t throw errors when i use the pool that it is a part of i set the scrutiny dashboard to use smart values and not the scrutiny ones.
etorix
February 16, 2026, 9:44am
7
You cut off the most critical line (#5 Reallocated). The drive may pass SMART tests but it seems to be growing bad sectors fast, which means it is due for RMA.
Please go to the CLI (or, better, an SSH session) and paste as formatted text (</> button or troiple backquotes as below) the full output of smartctl -x /dev/sdX where X is the appropriate drive letter
```
ZFS errors are logical errors, i.e. data corruption. SMART errors are failing hardware.
rosk
February 16, 2026, 9:55am
8
=== START OF INFORMATION SECTION ===
Device Model:     TOSHIBA HDWG51GUZSVA
Serial Number:    Y5L2A00YFQ5H
LU WWN Device Id: 5 000039 e68d91022
Firmware Version: 0108
User Capacity:    16,000,900,661,248 bytes [16.0 TB]
Sector Sizes:     512 bytes logical, 4096 bytes physical
Rotation Rate:    7200 rpm
Form Factor:      3.5 inches
Device is:        Not in smartctl database 7.3/5528
ATA Version is:   ACS-4 T13/BSR INCITS 529 revision 5
SATA Version is:  SATA 3.3, 6.0 Gb/s (current: 6.0 Gb/s)
Local Time is:    Mon Feb 16 10:51:45 2026 CET
SMART support is: Available - device has SMART capability.
SMART support is: Enabled
AAM feature is:   Unavailable
APM feature is:   Disabled
Rd look-ahead is: Enabled
Write cache is:   Disabled
DSN feature is:   Disabled
ATA Security is:  Disabled, NOT FROZEN [SEC1]
Wt Cache Reorder: Enabled

=== START OF READ SMART DATA SECTION ===
SMART overall-health self-assessment test result: PASSED

General SMART Values:
Offline data collection status:  (0x86) Offline data collection activity
was aborted by the device with a fatal error.
Auto Offline Data Collection: Enabled.
Self-test execution status:      (   0) The previous self-test routine completed
without error or no self-test has ever
been run.
Total time to complete Offline
data collection:                (  120) seconds.
Offline data collection
capabilities:                    (0x5b) SMART execute Offline immediate.
Auto Offline data collection on/off support.
Suspend Offline collection upon new
command.
Offline surface scan supported.
Self-test supported.
No Conveyance Self-test supported.
Selective Self-test supported.
SMART capabilities:            (0x0003) Saves SMART data before entering
power-saving mode.
Supports SMART auto save timer.
Error logging capability:        (0x01) Error logging supported.
General Purpose Logging supported.
Short self-test routine
recommended polling time:        (   2) minutes.
Extended self-test routine
recommended polling time:        (1341) minutes.
SCT capabilities:              (0x003d) SCT Status supported.
SCT Error Recovery Control supported.
SCT Feature Control supported.
SCT Data Table supported.

SMART Attributes Data Structure revision number: 16
Vendor Specific SMART Attributes with Thresholds:
ID# ATTRIBUTE_NAME          FLAGS    VALUE WORST THRESH FAIL RAW_VALUE
1 Raw_Read_Error_Rate     PO-R--   100   090   050    -    0
2 Throughput_Performance  P-S—   100   100   050    -    0
3 Spin_Up_Time            POS–K   100   100   001    -    8775
4 Start_Stop_Count        -O–CK   100   100   000    -    3
5 Reallocated_Sector_Ct   PO–CK   100   100   010    -    0
7 Seek_Error_Rate         PO-R--   100   100   050    -    0
8 Seek_Time_Performance   P-S—   100   100   050    -    0
9 Power_On_Hours          -O–CK   099   099   000    -    616
10 Spin_Retry_Count        PO–CK   100   100   030    -    0
12 Power_Cycle_Count       -O–CK   100   100   000    -    3
23 Unknown_Attribute       PO—K   100   100   075    -    0
24 Unknown_Attribute       PO—K   100   100   075    -    0
27 Unknown_Attribute       PO—K   100   100   030    -    789339
191 G-Sense_Error_Rate      -O–CK   100   100   000    -    0
192 Power-Off_Retract_Count -O–CK   100   100   000    -    2
193 Load_Cycle_Count        -O–CK   100   100   000    -    3
194 Temperature_Celsius     -O—K   100   100   000    -    25 (Min/Max 12/31)
196 Reallocated_Event_Count PO–CK   100   100   010    -    0
197 Current_Pending_Sector  -O–CK   100   100   000    -    1051
198 Offline_Uncorrectable   ----CK   001   001   000    -    1180
199 UDMA_CRC_Error_Count    -O–CK   200   200   000    -    0
220 Disk_Shift              -O----   100   100   000    -    252837925
222 Loaded_Hours            -O–CK   099   099   000    -    616
223 Load_Retry_Count        -O–CK   100   100   000    -    0
224 Load_Friction           -O—K   100   100   000    -    0
226 Load-in_Time            -OS–K   100   100   000    -    679
240 Head_Flying_Hours       P-----   100   100   001    -    0
241 Total_LBAs_Written      -O–CK   100   100   000    -    18300585744
242 Total_LBAs_Read         -O–CK   100   100   000    -    14181328803
||||||_ K auto-keep
|||||__ C event count
||||__ R error rate
|||__ S speed/performance
||__ O updated online
|______ P prefailure warning

General Purpose Log Directory Version 1
SMART           Log Directory Version 1 [multi-sector log support]
Address    Access  R/W   Size  Description
0x00       GPL,SL  R/O      1  Log Directory
0x01           SL  R/O      1  Summary SMART error log
0x02           SL  R/O     51  Comprehensive SMART error log
0x03       GPL     R/O      5  Ext. Comprehensive SMART error log
0x04       GPL,SL  R/O      8  Device Statistics log
0x06           SL  R/O      1  SMART self-test log
0x07       GPL     R/O      1  Extended self-test log
0x08       GPL     R/O      2  Power Conditions log
0x09           SL  R/W      1  Selective self-test log
0x0a       GPL     R/W      2  Device Statistics Notification
0x0c       GPL     R/O    513  Pending Defects log
0x10       GPL     R/O      1  NCQ Command Error log
0x11       GPL     R/O      1  SATA Phy Event Counters log
0x24       GPL     R/O  53248  Current Device Internal Status Data log
0x25       GPL     R/O  53248  Saved Device Internal Status Data log
0x2f       GPL     R/O      1  Set Sector Configuration
0x30       GPL,SL  R/O      9  IDENTIFY DEVICE data log
0x80-0x9f  GPL,SL  R/W     16  Host vendor specific log
0xae       GPL     VS      25  Device vendor specific log
0xe0       GPL,SL  R/W      1  SCT Command/Status
0xe1       GPL,SL  R/W      1  SCT Data Transfer

SMART Extended Comprehensive Error Log Version: 1 (5 sectors)
No Errors Logged

SMART Extended Self-test Log Version: 1 (1 sectors)
No self-tests have been logged.  [To run self-tests, use: smartctl -t]

SMART Selective self-test log data structure revision number 1
SPAN  MIN_LBA  MAX_LBA  CURRENT_TEST_STATUS
1        0        0  Not_testing
2        0        0  Not_testing
3        0        0  Not_testing
4        0        0  Not_testing
5        0        0  Not_testing
Selective self-test flags (0x0):
After scanning selected spans, do NOT read-scan remainder of disk.
If Selective self-test is pending on power-up, resume after 0 minute delay.

SCT Status Version:                  3
SCT Version (vendor specific):       1 (0x0001)
Device State:                        Active (0)
Current Temperature:                    25 Celsius
Power Cycle Min/Max Temperature:     12/31 Celsius
Lifetime    Min/Max Temperature:     12/31 Celsius
Specified Max Operating Temperature:    55 Celsius
Under/Over Temperature Limit Count:   0/0
SMART Status:                        0xc24f (PASSED)
Vendor specific:
00 00 02 00 00 00 00 00 00 00 00 00 00 00 00 00
00 00 00 00 00 00 00 00 00 00 00 00 00 00 00 00

SCT Temperature History Version:     2
Temperature Sampling Period:         1 minute
Temperature Logging Interval:        1 minute
Min/Max recommended Temperature:      5/55 Celsius
Min/Max Temperature Limit:           -40/70 Celsius
Temperature History Size (Index):    478 (185)

Index    Estimated Time   Temperature Celsius
186    2026-02-16 02:54    29  **********
187    2026-02-16 02:55    28  *********
…    ..( 10 skipped).    ..  *********
198    2026-02-16 03:06    28  *********
199    2026-02-16 03:07    29  **********
…    ..(  8 skipped).    ..  **********
208    2026-02-16 03:16    29  **********
209    2026-02-16 03:17    30  ***********
…    ..( 19 skipped).    ..  ***********
229    2026-02-16 03:37    30  ***********
230    2026-02-16 03:38    29  **********
231    2026-02-16 03:39    29  **********
232    2026-02-16 03:40    29  **********
233    2026-02-16 03:41    28  *********
…    ..(  3 skipped).    ..  *********
237    2026-02-16 03:45    28  *********
238    2026-02-16 03:46    27  ********
…    ..(  5 skipped).    ..  ********
244    2026-02-16 03:52    27  ********
245    2026-02-16 03:53    26  *******
…    ..( 30 skipped).    ..  *******
276    2026-02-16 04:24    26  *******
277    2026-02-16 04:25    25  ******
278    2026-02-16 04:26    26  *******
279    2026-02-16 04:27    26  *******
280    2026-02-16 04:28    25  ******
281    2026-02-16 04:29    26  *******
282    2026-02-16 04:30    25  ******
…    ..(318 skipped).    ..  ******
123    2026-02-16 09:49    25  ******
124    2026-02-16 09:50    24  *****
125    2026-02-16 09:51    25  ******
…    ..(  2 skipped).    ..  ******
128    2026-02-16 09:54    25  ******
129    2026-02-16 09:55    24  *****
…    ..( 10 skipped).    ..  *****
140    2026-02-16 10:06    24  *****
141    2026-02-16 10:07    25  ******
142    2026-02-16 10:08    24  *****
143    2026-02-16 10:09    24  *****
144    2026-02-16 10:10    25  ******
145    2026-02-16 10:11    24  *****
146    2026-02-16 10:12    25  ******
147    2026-02-16 10:13    25  ******
148    2026-02-16 10:14    24  *****
…    ..(  3 skipped).    ..  *****
152    2026-02-16 10:18    24  *****
153    2026-02-16 10:19    25  ******
154    2026-02-16 10:20    24  *****
155    2026-02-16 10:21    24  *****
156    2026-02-16 10:22    24  *****
157    2026-02-16 10:23    25  ******
158    2026-02-16 10:24    24  *****
159    2026-02-16 10:25    24  *****
160    2026-02-16 10:26    25  ******
161    2026-02-16 10:27    25  ******
162    2026-02-16 10:28    24  *****
…    ..(  3 skipped).    ..  *****
166    2026-02-16 10:32    24  *****
167    2026-02-16 10:33    25  ******
…    ..(  3 skipped).    ..  ******
171    2026-02-16 10:37    25  ******
172    2026-02-16 10:38    24  *****
173    2026-02-16 10:39    25  ******
174    2026-02-16 10:40    25  ******
175    2026-02-16 10:41    24  *****
176    2026-02-16 10:42    24  *****
177    2026-02-16 10:43    24  *****
178    2026-02-16 10:44    25  ******
179    2026-02-16 10:45    25  ******
180    2026-02-16 10:46    24  *****
181    2026-02-16 10:47    24  *****
182    2026-02-16 10:48    25  ******
…    ..(  2 skipped).    ..  ******
185    2026-02-16 10:51    25  ******

SCT Error Recovery Control:
Read: Disabled
Write: Disabled

Device Statistics (GP Log 0x04)
Page  Offset Size        Value Flags Description
0x01  =====  =               =  ===  == General Statistics (rev 3) ==
0x01  0x008  4               3  —  Lifetime Power-On Resets
0x01  0x010  4             616  —  Power-on Hours
0x01  0x018  6     18300585744  —  Logical Sectors Written
0x01  0x020  6        16786746  —  Number of Write Commands
0x01  0x028  6     14181328803  —  Logical Sectors Read
0x01  0x030  6        24730962  —  Number of Read Commands
0x01  0x038  6      2217600000  —  Date and Time TimeStamp
0x01  0x040  4            8408  —  Pending Error Count
0x02  =====  =               =  ===  == Free-Fall Statistics (rev 1) ==
0x02  0x010  4               0  —  Overlimit Shock Events
0x03  =====  =               =  ===  == Rotating Media Statistics (rev 1) ==
0x03  0x008  4             616  —  Spindle Motor Power-on Hours
0x03  0x010  4             616  —  Head Flying Hours
0x03  0x018  4               3  —  Head Load Events
0x03  0x020  4               0  —  Number of Reallocated Logical Sectors
0x03  0x028  4         3835696  —  Read Recovery Attempts
0x03  0x030  4               0  —  Number of Mechanical Start Failures
0x03  0x038  4            8408  —  Number of Realloc. Candidate Logical Sectors
0x03  0x040  4               2  —  Number of High Priority Unload Events
0x04  =====  =               =  ===  == General Errors Statistics (rev 1) ==
0x04  0x008  4               0  —  Number of Reported Uncorrectable Errors
0x04  0x010  4               0  —  Resets Between Cmd Acceptance and Completion
0x04  0x018  4               0  -D-  Physical Element Status Changed
0x05  =====  =               =  ===  == Temperature Statistics (rev 1) ==
0x05  0x008  1              25  —  Current Temperature
0x05  0x010  1              25  N--  Average Short Term Temperature
0x05  0x018  1               -  N--  Average Long Term Temperature
0x05  0x020  1              31  —  Highest Temperature
0x05  0x028  1              12  —  Lowest Temperature
0x05  0x030  1              28  N--  Highest Average Short Term Temperature
0x05  0x038  1              20  N--  Lowest Average Short Term Temperature
0x05  0x040  1               -  N--  Highest Average Long Term Temperature
0x05  0x048  1               -  N--  Lowest Average Long Term Temperature
0x05  0x050  4               0  —  Time in Over-Temperature
0x05  0x058  1              55  —  Specified Maximum Operating Temperature
0x05  0x060  4               0  —  Time in Under-Temperature
0x05  0x068  1               5  —  Specified Minimum Operating Temperature
0x06  =====  =               =  ===  == Transport Statistics (rev 1) ==
0x06  0x008  4              13  —  Number of Hardware Resets
0x06  0x010  4               3  —  Number of ASR Events
0x06  0x018  4               0  —  Number of Interface CRC Errors
0x07  =====  =               =  ===  == Solid State Device Statistics (rev 1) ==
|||_ C monitored condition met
||__ D supports DSN
|___ N normalized value

Pending Defects log (GP Log 0x0c)
Index                LBA    Hours
0        25201417496      412
1        25201417497      412
2        25201417498      412
3        25201417499      412
4        25201417500      412
5        25201417501      412
6        25201417502      412
7        25201417503      412
8        25201417528      412
9        25201417529      412
10        25201417530      412
11        25201417531      412
12        25201417532      412
13        25201417533      412
14        25201417534      412
15        25201417535      412
16        25605076488      413
17        25605076489      413
18        25605076490      413
19        25605076491      413
20        25605076492      413
21        25605076493      413
22        25605076494      413
23        25605076495      413
24        25605079360      413
25        25605079361      413
26        25605079362      413
27        25605079363      413
28        25605079364      413
29        25605079365      413
30        25605079366      413
… (8377 entries not shown)

SATA Phy Event Counters (GP Log 0x11)
ID      Size     Value  Description
0x0001  4            0  Command failed due to ICRC error
0x0002  4            0  R_ERR response for data FIS
0x0003  4            0  R_ERR response for device-to-host data FIS
0x0004  4            0  R_ERR response for host-to-device data FIS
0x0005  4            0  R_ERR response for non-data FIS
0x0006  4            0  R_ERR response for device-to-host non-data FIS
0x0007  4            0  R_ERR response for host-to-device non-data FIS
0x0008  4            0  Device-to-host non-data FIS retries
0x0009  4           14  Transition from drive PhyRdy to drive PhyNRdy
0x000a  4            6  Device-to-host register FISes sent due to a COMRESET
0x000b  4            0  CRC errors within host-to-device FIS
0x000d  4            0  Non-CRC errors within host-to-device FIS
0x000f  4            0  R_ERR response for host-to-device data FIS, CRC
0x0010  4            0  R_ERR response for host-to-device data FIS, non-CRC
0x0012  4            0  R_ERR response for host-to-device non-data FIS, CRC
0x0013  4            0  R_ERR response for host-to-device non-data FIS, non-CRC
1 Like
etorix
February 16, 2026, 10:09am
9
The non-zero value I thought I saw on #196 was a threshold. No permanent damage confirmed yet, but these 1000+ dubious sectors on a new drive are not good.smartctl -t long /dev/sdX
Good cooling, by the way.
2 Likes
rosk
February 17, 2026, 12:34pm
10
=== START OF INFORMATION SECTION ===
Device Model:     TOSHIBA HDWG51GUZSVA
Serial Number:    Y5L2A00YFQ5H
LU WWN Device Id: 5 000039 e68d91022
Firmware Version: 0108
User Capacity:    16,000,900,661,248 bytes [16.0 TB]
Sector Sizes:     512 bytes logical, 4096 bytes physical
Rotation Rate:    7200 rpm
Form Factor:      3.5 inches
Device is:        Not in smartctl database 7.3/5528
ATA Version is:   ACS-4 T13/BSR INCITS 529 revision 5
SATA Version is:  SATA 3.3, 6.0 Gb/s (current: 6.0 Gb/s)
Local Time is:    Tue Feb 17 13:30:57 2026 CET
SMART support is: Available - device has SMART capability.
SMART support is: Enabled
AAM feature is:   Unavailable
APM feature is:   Disabled
Rd look-ahead is: Enabled
Write cache is:   Disabled
DSN feature is:   Disabled
ATA Security is:  Disabled, NOT FROZEN [SEC1]
Wt Cache Reorder: Enabled

=== START OF READ SMART DATA SECTION ===
SMART overall-health self-assessment test result: FAILED!
Drive failure expected in less than 24 hours. SAVE ALL DATA.
See vendor-specific Attribute list for failed Attributes.

General SMART Values:
Offline data collection status:  (0x86) Offline data collection activity
was aborted by the device with a fatal error.
Auto Offline Data Collection: Enabled.
Self-test execution status:      ( 242) Self-test routine in progress…
20% of test remaining.
Total time to complete Offline
data collection:                (  120) seconds.
Offline data collection
capabilities:                    (0x5b) SMART execute Offline immediate.
Auto Offline data collection on/off support.
Suspend Offline collection upon new
command.
Offline surface scan supported.
Self-test supported.
No Conveyance Self-test supported.
Selective Self-test supported.
SMART capabilities:            (0x0003) Saves SMART data before entering
power-saving mode.
Supports SMART auto save timer.
Error logging capability:        (0x01) Error logging supported.
General Purpose Logging supported.
Short self-test routine
recommended polling time:        (   2) minutes.
Extended self-test routine
recommended polling time:        (1341) minutes.
SCT capabilities:              (0x003d) SCT Status supported.
SCT Error Recovery Control supported.
SCT Feature Control supported.
SCT Data Table supported.

SMART Attributes Data Structure revision number: 16
Vendor Specific SMART Attributes with Thresholds:
ID# ATTRIBUTE_NAME          FLAGS    VALUE WORST THRESH FAIL RAW_VALUE
1 Raw_Read_Error_Rate     PO-R--   040   040   050    NOW  0
2 Throughput_Performance  P-S—   100   100   050    -    0
3 Spin_Up_Time            POS–K   100   100   001    -    8775
4 Start_Stop_Count        -O–CK   100   100   000    -    3
5 Reallocated_Sector_Ct   PO–CK   100   100   010    -    11
7 Seek_Error_Rate         PO-R--   100   100   050    -    0
8 Seek_Time_Performance   P-S—   100   100   050    -    0
9 Power_On_Hours          -O–CK   099   099   000    -    642
10 Spin_Retry_Count        PO–CK   100   100   030    -    0
12 Power_Cycle_Count       -O–CK   100   100   000    -    3
23 Unknown_Attribute       PO—K   100   100   075    -    0
24 Unknown_Attribute       PO—K   100   100   075    -    0
27 Unknown_Attribute       PO—K   100   100   030    -    789338
191 G-Sense_Error_Rate      -O–CK   100   100   000    -    0
192 Power-Off_Retract_Count -O–CK   100   100   000    -    2
193 Load_Cycle_Count        -O–CK   100   100   000    -    3
194 Temperature_Celsius     -O—K   100   100   000    -    28 (Min/Max 12/31)
196 Reallocated_Event_Count PO–CK   100   100   010    -    11
197 Current_Pending_Sector  -O–CK   100   100   000    -    1107
198 Offline_Uncorrectable   ----CK   001   001   000    -    1180
199 UDMA_CRC_Error_Count    -O–CK   200   200   000    -    0
220 Disk_Shift              -O----   100   100   000    -    68550694
222 Loaded_Hours            -O–CK   099   099   000    -    642
223 Load_Retry_Count        -O–CK   100   100   000    -    0
224 Load_Friction           -O—K   100   100   000    -    0
226 Load-in_Time            -OS–K   100   100   000    -    679
240 Head_Flying_Hours       P-----   100   100   001    -    0
241 Total_LBAs_Written      -O–CK   100   100   000    -    18300585744
242 Total_LBAs_Read         -O–CK   100   100   000    -    14578391907
||||||_ K auto-keep
|||||__ C event count
||||___ R error rate
|||____ S speed/performance
||_____ O updated online
|______ P prefailure warning

General Purpose Log Directory Version 1
SMART           Log Directory Version 1 [multi-sector log support]
Address    Access  R/W   Size  Description
0x00       GPL,SL  R/O      1  Log Directory
0x01           SL  R/O      1  Summary SMART error log
0x02           SL  R/O     51  Comprehensive SMART error log
0x03       GPL     R/O      5  Ext. Comprehensive SMART error log
0x04       GPL,SL  R/O      8  Device Statistics log
0x06           SL  R/O      1  SMART self-test log
0x07       GPL     R/O      1  Extended self-test log
0x08       GPL     R/O      2  Power Conditions log
0x09           SL  R/W      1  Selective self-test log
0x0a       GPL     R/W      2  Device Statistics Notification
0x0c       GPL     R/O    513  Pending Defects log
0x10       GPL     R/O      1  NCQ Command Error log
0x11       GPL     R/O      1  SATA Phy Event Counters log
0x24       GPL     R/O  53248  Current Device Internal Status Data log
0x25       GPL     R/O  53248  Saved Device Internal Status Data log
0x2f       GPL     R/O      1  Set Sector Configuration
0x30       GPL,SL  R/O      9  IDENTIFY DEVICE data log
0x80-0x9f  GPL,SL  R/W     16  Host vendor specific log
0xae       GPL     VS      25  Device vendor specific log
0xe0       GPL,SL  R/W      1  SCT Command/Status
0xe1       GPL,SL  R/W      1  SCT Data Transfer

SMART Extended Comprehensive Error Log Version: 1 (5 sectors)
No Errors Logged

SMART Extended Self-test Log Version: 1 (1 sectors)
No self-tests have been logged.  [To run self-tests, use: smartctl -t]

SMART Selective self-test log data structure revision number 1
SPAN  MIN_LBA  MAX_LBA  CURRENT_TEST_STATUS
1        0        0  Not_testing
2        0        0  Not_testing
3        0        0  Not_testing
4        0        0  Not_testing
5        0        0  Not_testing
Selective self-test flags (0x0):
After scanning selected spans, do NOT read-scan remainder of disk.
If Selective self-test is pending on power-up, resume after 0 minute delay.

SCT Status Version:                  3
SCT Version (vendor specific):       1 (0x0001)
Device State:                        DST executing in background (3)
Current Temperature:                    28 Celsius
Power Cycle Min/Max Temperature:     12/31 Celsius
Lifetime    Min/Max Temperature:     12/31 Celsius
Specified Max Operating Temperature:    55 Celsius
Under/Over Temperature Limit Count:   0/0
SMART Status:                        0x2cf4 (FAILED)
Vendor specific:
00 00 02 00 00 00 00 00 00 00 00 00 00 00 00 00
00 00 00 00 00 00 00 00 00 00 00 00 00 00 00 00

SCT Temperature History Version:     2
Temperature Sampling Period:         1 minute
Temperature Logging Interval:        1 minute
Min/Max recommended Temperature:      5/55 Celsius
Min/Max Temperature Limit:           -40/70 Celsius
Temperature History Size (Index):    478 (350)

Index    Estimated Time   Temperature Celsius
351    2026-02-17 05:33    28  *********
…    ..(476 skipped).    ..  *********
350    2026-02-17 13:30    28  *********

SCT Error Recovery Control:
Read: Disabled
Write: Disabled

Device Statistics (GP Log 0x04)
Page  Offset Size        Value Flags Description
0x01  =====  =               =  ===  == General Statistics (rev 3) ==
0x01  0x008  4               3  —  Lifetime Power-On Resets
0x01  0x010  4             642  —  Power-on Hours
0x01  0x018  6     18300585744  —  Logical Sectors Written
0x01  0x020  6        16786746  —  Number of Write Commands
0x01  0x028  6     14578391907  —  Logical Sectors Read
0x01  0x030  6        26041930  —  Number of Read Commands
0x01  0x038  6      2311200000  —  Date and Time TimeStamp
0x01  0x040  4            8856  —  Pending Error Count
0x02  =====  =               =  ===  == Free-Fall Statistics (rev 1) ==
0x02  0x010  4               0  —  Overlimit Shock Events
0x03  =====  =               =  ===  == Rotating Media Statistics (rev 1) ==
0x03  0x008  4             642  —  Spindle Motor Power-on Hours
0x03  0x010  4             642  —  Head Flying Hours
0x03  0x018  4               3  —  Head Load Events
0x03  0x020  4              88  —  Number of Reallocated Logical Sectors
0x03  0x028  4         6137520  —  Read Recovery Attempts
0x03  0x030  4               0  —  Number of Mechanical Start Failures
0x03  0x038  4            8856  —  Number of Realloc. Candidate Logical Sectors
0x03  0x040  4               2  —  Number of High Priority Unload Events
0x04  =====  =               =  ===  == General Errors Statistics (rev 1) ==
0x04  0x008  4               0  —  Number of Reported Uncorrectable Errors
0x04  0x010  4               0  —  Resets Between Cmd Acceptance and Completion
0x04  0x018  4               1  -D-  Physical Element Status Changed
0x05  =====  =               =  ===  == Temperature Statistics (rev 1) ==
0x05  0x008  1              28  —  Current Temperature
0x05  0x010  1              28  N--  Average Short Term Temperature
0x05  0x018  1               -  N--  Average Long Term Temperature
0x05  0x020  1              31  —  Highest Temperature
0x05  0x028  1              12  —  Lowest Temperature
0x05  0x030  1              28  N--  Highest Average Short Term Temperature
0x05  0x038  1              20  N--  Lowest Average Short Term Temperature
0x05  0x040  1               -  N--  Highest Average Long Term Temperature
0x05  0x048  1               -  N--  Lowest Average Long Term Temperature
0x05  0x050  4               0  —  Time in Over-Temperature
0x05  0x058  1              55  —  Specified Maximum Operating Temperature
0x05  0x060  4               0  —  Time in Under-Temperature
0x05  0x068  1               5  —  Specified Minimum Operating Temperature
0x06  =====  =               =  ===  == Transport Statistics (rev 1) ==
0x06  0x008  4              13  —  Number of Hardware Resets
0x06  0x010  4               3  —  Number of ASR Events
0x06  0x018  4               0  —  Number of Interface CRC Errors
0x07  =====  =               =  ===  == Solid State Device Statistics (rev 1) ==
|||_ C monitored condition met
||__ D supports DSN
|___ N normalized value

Pending Defects log (GP Log 0x0c)
Index                LBA    Hours
0        25037194344      640
1        25037194345      640
2        25037194346      640
3        25037194347      640
4        25037194348      640
5        25037194349      640
6        25037194350      640
7        25037194351      640
8        25201417520      640
9        25201417521      640
10        25201417522      640
11        25201417523      640
12        25201417524      640
13        25201417525      640
14        25201417526      640
15        25201417527      640
16        25201417528      412
17        25201417529      412
18        25201417530      412
19        25201417531      412
20        25201417532      412
21        25201417533      412
22        25201417534      412
23        25201417535      412
24        25201420512      640
25        25201420513      640
26        25201420514      640
27        25201420515      640
28        25201420516      640
29        25201420517      640
30        25201420518      640
… (8825 entries not shown)

SATA Phy Event Counters (GP Log 0x11)
ID      Size     Value  Description
0x0001  4            0  Command failed due to ICRC error
0x0002  4            0  R_ERR response for data FIS
0x0003  4            0  R_ERR response for device-to-host data FIS
0x0004  4            0  R_ERR response for host-to-device data FIS
0x0005  4            0  R_ERR response for non-data FIS
0x0006  4            0  R_ERR response for device-to-host non-data FIS
0x0007  4            0  R_ERR response for host-to-device non-data FIS
0x0008  4            0  Device-to-host non-data FIS retries
0x0009  4           14  Transition from drive PhyRdy to drive PhyNRdy
0x000a  4            6  Device-to-host register FISes sent due to a COMRESET
0x000b  4            0  CRC errors within host-to-device FIS
0x000d  4            0  Non-CRC errors within host-to-device FIS
0x000f  4            0  R_ERR response for host-to-device data FIS, CRC
0x0010  4            0  R_ERR response for host-to-device data FIS, non-CRC
0x0012  4            0  R_ERR response for host-to-device non-data FIS, CRC
0x0013  4            0  R_ERR response for host-to-device non-data FIS, non-CRC
Looks like the disk is gone…
1 Like