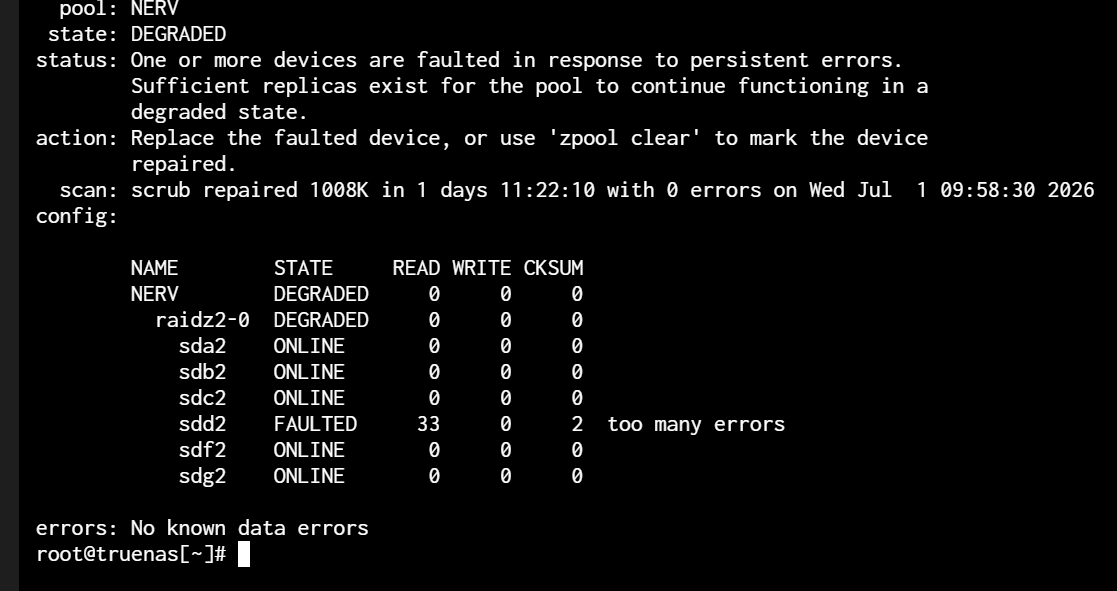
Just wondering if anyone can clue me in on why the scrub time is so long on this? (16 days) Have I got something incorrectly configured or is that just what it is?
Ryzen 3600
X570 Crosshair
64 gig of ECC
6 x Seagate Exos X18 18TB
What is the pool layout? Raid-Z(1,2,3), Mirrors, etc. How full is the pool? How much data? More data would mean longer scrub times. Is that an estimated scrub time or the actual reported time from a previous scrub? Was there a lot of other access while the scrub was happening?
I think I am at about a day (22 hours 42 minutes 58 seconds) for aprox 13.88TiB on a single drive pool. Just started a scrub a little bit ago and the GUI is estimating it about a 1.5 days.
1 x RAIDZ2 | 6 wide | 16.37 TiB Used: 26.33 TiB Available: 38.95 TiB 40.3% Full. The NAS isn’t doing anything else atm, not running anything on it locally, not copying to or from it etc. It’s basically a big external HDD for how it gets used. I never had scrubs set up in the past but while helping a friend set up his recently I watched an updated guide that recommended setting it up monthly so this is the 1st scrub ever. It’s dropped down to a mere 10 days and 11 hours now in the GUI.
It’s all video files, though there is trickplay files for every video from jellyfin so maybe that? This is the 1st time I have scrubbed it since it’s been built, didn’t know it was a thing.
ZFS Status gives me -
Last login: Tue Jun 30 16:41:44 ACST 2026 on pts/0
root@truenas[~]# zpool status
pool: NERV
state: ONLINE
status: One or more devices has experienced an unrecoverable error. An
attempt was made to correct the error. Applications are unaffected.
action: Determine if the device needs to be replaced, and clear the errors
using ‘zpool clear’ or replace the device with ‘zpool replace’.
see: Message ID: ZFS-8000-9P — OpenZFS documentation
scan: scrub in progress since Mon Jun 29 22:36:20 2026
4.82T / 39.5T scanned at 76.9M/s, 2.77T / 39.5T issued at 44.2M/s
0B repaired, 7.00% done, 10 days 02:21:00 to go
config:
pool: boot-pool
state: ONLINE
status: One or more features are enabled on the pool despite not being
requested by the ‘compatibility’ property.
action: Consider setting ‘compatibility’ to an appropriate value, or
adding needed features to the relevant file in
/etc/zfs/compatibility.d or /usr/share/zfs/compatibility.d.
scan: scrub repaired 0B in 00:00:33 with 0 errors on Sat Jun 27 03:45:34 2026
config:
    NAME                                                   STATE     READ WRITE CKSUM
    boot-pool                                              ONLINE       0     0     0
      ata-Samsung_SSD_870_EVO_250GB_S6P2NL0TA03833T-part2  ONLINE       0     0     0
Do you have any tasks shown on the Data Protection tab and Periodic S.M.A.R.T. Tests?
Check your Reporting, Disks tab over a days time. Is the graph the same for the entire period of your scrub? How are the disk temps?
I did a reboot and started a scrub. This is my graph for the boot drive and the data pool drive. This is what I would expect to see. System is idle with no Apps nor VMs. It just serves as SMB backup.
You should be able to see it at the end with zpool status -v NERV Why do you think there are broken files? Are you showing a lot more errors across the drives?
If it were just the two checksum errors on one drive, not increasing further, you’d do zpool clear NERV after checking drive health (parsing report after a long SMART test) and checking that cables are OK.
With a raidz2 your files are probably fine (software side), but you know face more investigation to find out why the pool went to “degraded” (likely hardware issue).
Turned NAS off to hook up another of the hot swap bays, re-booted, and every error had cleared. But then 1 came back on that same drive. Same serial I am pretty sure, just the sdd drive is now the sda one?